# OCR A: A-Level Physics

# Module 4

# 4.1 - Charge and Current

## Key info and definitions

## Electric Circuit Components

[![image.png](https://bookstack.asadhussain.net/uploads/images/gallery/2026-02/scaled-1680-/lNSimage.png)](https://bookstack.asadhussain.net/uploads/images/gallery/2026-02/lNSimage.png)

1. **Junction of conductors:** Allows current to split; resistance is typically low but increases with temperature.
2. **Conductors crossing (no connection):** Allows current to flow across a circuit without connecting to the crossing wire; resistance is typically low.
3. **Switch:** Turns current on and off; resistance is low when closed and very high (due to an air gap) when open.
4. **Cell:** Provides a source of energy or e.m.f. (electromotive force); resistance is low or negligible.
5. **Battery:** A combination of two or more cells; internal resistance increases as more cells are added in series.
6. **Terminals:** Provides a connection point for a source of energy; resistance is low.
7. **Lamp:** Transfers electrical energy into light; resistance increases as the current increases.
8. **Fixed resistor:** Controls the amount of current; resistance is fixed and determined by its material (often semiconductors like silicon).
9. **Variable resistor:** Controls current flow manually; resistance changes based on the slider or dial setting.
10. **Fuse:** A safety device that melts if current is too high; resistance is typically low and depends on the wire's dimensions and material.
11. **Heater:** Transfers electrical energy into thermal energy; resistance is typically high.
12. **Ammeter:** Measures the electrical current in a circuit; resistance is very low.
13. **Voltmeter:** Measures the potential difference (e.m.f.) across a component; resistance is very high.
14. **Thermistor:** Responds to environmental temperature; resistance changes in response to the temperature of the surroundings.
15. **Diode:** Restricts current to one direction; resistance is low in forward bias and very high in reverse bias.
16. **Light-emitting diode (LED):** Allows current in one direction and emits light; resistance is low in forward bias and high in reverse bias.
17. **Light-dependent resistor (LDR):** Changes current based on light levels; resistance decreases as light intensity increases.

## Electric Current and Charge

Current is the rate of flow of electrical charge.

[![image.png](https://bookstack.asadhussain.net/uploads/images/gallery/2026-02/scaled-1680-/bJiimage.png)](https://bookstack.asadhussain.net/uploads/images/gallery/2026-02/bJiimage.png)

... where Q is charge and t is time.

Atoms become charged when they gain or lose electrons.

Conventional current travels in the **direction of flow of positive charge** - i.e. the opposite of electron flow.

### Kirchoff's Laws

1. The sum of electrical current into a junction is equal to the sum of electrical current out of a junction. Ensures conservation of charge, as flow of charge into a junction point = flow of charge out of the junction point.
2. In a closed loop of a circuit, the sum of potential differences is equal to the sum of emfs. Ensures conservation of energy, as energy into the circuit = energy out of the circuit.

## Electron Drift Velocity

When conducting electricity, electrons move slowly through the wire at a drift velocity v.

[![image.png](https://bookstack.asadhussain.net/uploads/images/gallery/2026-02/scaled-1680-/V3Simage.png)](https://bookstack.asadhussain.net/uploads/images/gallery/2026-02/V3Simage.png)

... where I is current, n is number density of the wire's conducting material, A is the cross sectional area of the wire, v is the electron drift velocity, and e is the elementary charge, 1.6e-19C.

The larger the value of n, the greater the conductivity of the metal.

# 4.2 - Energy, Power, and Resistance

## Potential Difference and EMF

- Potential difference is the energy transferred per unit charge from electrical energy to other forms, such as light and sound.
- EMF is the energy transferred from an energy source, such as chemical energy in cells, to electrical energy.

[![image.png](https://bookstack.asadhussain.net/uploads/images/gallery/2026-02/scaled-1680-/bFbimage.png)](https://bookstack.asadhussain.net/uploads/images/gallery/2026-02/bFbimage.png)

The change in kinetic energy of one particle accelerated through a potential difference is:

[![image.png](https://bookstack.asadhussain.net/uploads/images/gallery/2026-02/scaled-1680-/M18image.png)](https://bookstack.asadhussain.net/uploads/images/gallery/2026-02/M18image.png)

... where q is its charge and v is the velocity gained in this acceleration.

## Resistance and Ohm's Law

Ohm's law states that the current through a conductor is directly proportional to the potential difference across it provided that physical conditions, such as temperature, remain constant.

[![image.png](https://bookstack.asadhussain.net/uploads/images/gallery/2026-02/scaled-1680-/iYnimage.png)](https://bookstack.asadhussain.net/uploads/images/gallery/2026-02/iYnimage.png)

... where V is potential difference across a component, I is current through it, and R is its resistance.

Wires can also have resistance. At a constant temperature, this is based on their resistivity rho (which is a property of the material), its length L, and its cross sectional area A.

## Resistivity

[![image.png](https://bookstack.asadhussain.net/uploads/images/gallery/2026-02/scaled-1680-/huVimage.png)](https://bookstack.asadhussain.net/uploads/images/gallery/2026-02/huVimage.png)

However, resistivity can also change with temperature. At higher temperatures, metal ions have more kinetic energy, so vibrate more vigorously. Furthermore, free electrons drift through the metal more quickly. This increases the rate of collisions between electrons and metal ions, reducing the flow of electrical current. As such, we can describe components as being an ohmic or non-ohmic conductor based on whether or not current and p.d. are directly proportional. E.g.:

- A normal resistor is an ohmic conductor.
- A thermistor is non-ohmic.
- A lamp is non-ohmic, as heat is generated in the filament in the process of creating light.

## I-V Characteristics of Different Components

<table border="1" id="bkmrk-resistor-ohmic-ntc-t" style="border-collapse: collapse; width: 100%; height: 216.2px;"><colgroup><col style="width: 20.8929%;"></col><col style="width: 79.2263%;"></col></colgroup><tbody><tr style="height: 29.8px;"><td style="height: 29.8px;">Resistor</td><td style="height: 29.8px;">Ohmic</td></tr><tr style="height: 63.4px;"><td style="height: 63.4px;">NTC thermistor</td><td style="height: 63.4px;">Non-ohmic, as resistance decreases with an increase in temperature. Ohmic behavior observed if in a constant temperature - however, a flow of current can cause it to heat itself up. Thermistors are created to be very sensitive to temperature changes.</td></tr><tr style="height: 29.8px;"><td style="height: 29.8px;">Light dependent resistors</td><td style="height: 29.8px;">Non-ohmic, as resistance varies with light. Ohmic behavior observed if in a constant light intensity.</td></tr><tr style="height: 46.6px;"><td style="height: 46.6px;">**Filament lamp**

</td><td style="height: 46.6px;">Non-ohmic, as this component works by heating up the filament to incredible temperatures in order to make it glow.

> <span style="font-family: 'Segoe UI';">Current has a heating effect, and the **increased temperature** causes more collisions with free electrons, causing an increase in the vibrational kinetic energy of the metal ions. This increases the resistant of the lamp Since V=IR, the current does not increase linearly with voltage.</span>

</td></tr><tr style="height: 46.6px;"><td style="height: 46.6px;">Diode / LED</td><td style="height: 46.6px;">Non-ohmic, as they have a threshold voltage (~0.5-0.6 ohms). Once reached, however, there is a linear I-V relationship.</td></tr></tbody></table>

## Electrical Power

Power is the rate at which energy is transferred from one form to another.

[![image.png](https://bookstack.asadhussain.net/uploads/images/gallery/2026-02/scaled-1680-/CtEimage.png)](https://bookstack.asadhussain.net/uploads/images/gallery/2026-02/CtEimage.png)

Cost of energy can be calculated using the unit kilowatt-hour (kWh), which measures the amount of energy transferred by a 1 kW device in one hour.

# 4.3 - Electrical Circuits

## Kirchoff's Laws

1. The sum of currents entering a junction in a circuit is equal to the sum of currents exiting this junction. This ensures conservation of charge.
2. The sum of emfs in a loop of a circuit is equal to the sum of potential differences of all components in the loop. This ensures conservation of energy.

## Resistance Sums

<table border="1" id="bkmrk-energy-must-be-conse" style="border-collapse: collapse; width: 100%;"><colgroup><col style="width: 99.881%;"></col></colgroup><tbody><tr><td>Energy must be conserved, so the sum of potential differences of the components must be equal to the pd across all relevant components (which can be emf). As per V = IR, we can express this as:

[![image.png](https://bookstack.asadhussain.net/uploads/images/gallery/2026-02/scaled-1680-/P7qimage.png)](https://bookstack.asadhussain.net/uploads/images/gallery/2026-02/P7qimage.png)

We can divide both sides by I to get:

[![image.png](https://bookstack.asadhussain.net/uploads/images/gallery/2026-02/scaled-1680-/536image.png)](https://bookstack.asadhussain.net/uploads/images/gallery/2026-02/536image.png)

</td></tr><tr><td>Again, energy must be conserved.

Total circuit current can be expressed using Kirchoff's 1st law as:

[![image.png](https://bookstack.asadhussain.net/uploads/images/gallery/2026-02/scaled-1680-/XmAimage.png)](https://bookstack.asadhussain.net/uploads/images/gallery/2026-02/XmAimage.png)

However, as per Kirchoff's 2nd law, voltage on each branch is equal:

[![image.png](https://bookstack.asadhussain.net/uploads/images/gallery/2026-02/scaled-1680-/mKCimage.png)](https://bookstack.asadhussain.net/uploads/images/gallery/2026-02/mKCimage.png)

Taking the first equation, as I=V/R:

[![image.png](https://bookstack.asadhussain.net/uploads/images/gallery/2026-02/scaled-1680-/aEmimage.png)](https://bookstack.asadhussain.net/uploads/images/gallery/2026-02/aEmimage.png)

Dividing through by V gives us:

[![image.png](https://bookstack.asadhussain.net/uploads/images/gallery/2026-02/scaled-1680-/D7eimage.png)](https://bookstack.asadhussain.net/uploads/images/gallery/2026-02/D7eimage.png)

</td></tr></tbody></table>

## Potential Dividers

Potential difference is split across resistors from the total voltage of a loop in a ratio based on resistance of each component. This enables the delivery of electrical power to multiple parts of a circuit in differing ratios.

[![image.png](https://bookstack.asadhussain.net/uploads/images/gallery/2026-02/scaled-1680-/bUZimage.png)](https://bookstack.asadhussain.net/uploads/images/gallery/2026-02/bUZimage.png)

## Internal resistance

Cells aren't perfect - they still have a small amount of resistance themselves due to differences in the material used for the cells. In manufacturing, this internal resistance is made to be as low as possible, but cannot reach zero.

[![image.png](https://bookstack.asadhussain.net/uploads/images/gallery/2026-02/scaled-1680-/2YBimage.png)](https://bookstack.asadhussain.net/uploads/images/gallery/2026-02/2YBimage.png)

... where E is emf, I is current, and r is internal resistance. E and r are constant values.

### Determining E and r

EMF and internal resistance can be experimentally determined by rearranging the above equation as follows:

[![image.png](https://bookstack.asadhussain.net/uploads/images/gallery/2026-02/scaled-1680-/DNGimage.png)](https://bookstack.asadhussain.net/uploads/images/gallery/2026-02/DNGimage.png)

Method:

1. Place the power source in series with an ammeter and a variable resistor, with a voltmeter parallel to the power source:  
    [![image.png](https://bookstack.asadhussain.net/uploads/images/gallery/2026-02/scaled-1680-/AM1image.png)](https://bookstack.asadhussain.net/uploads/images/gallery/2026-02/AM1image.png)
2. Start with a high value of resistance and record current I in amps from the ammeter with potential difference V in volts from the voltmeter in a table.
3. Repeat, decreasing the resistance such that the current I decreases in fixed intervals as per V=IR.
4. Plot a graph of V against I and draw a line of best fit. The y-intercept is the emf, and the gradient of the line is the negative of internal resistance.

## Multiple Sources of EMF

If two sources of EMF are pointing in opposite directions in a loop, the EMF of the loop is equal to the difference between them. E.g. in the following circuit, the EMF is 9-6=3:

[![image.png](https://bookstack.asadhussain.net/uploads/images/gallery/2026-02/scaled-1680-/eTvimage.png)](https://bookstack.asadhussain.net/uploads/images/gallery/2026-02/eTvimage.png)

If they were pointing in the same direction, they would add to 9+6=15.

# 4.4 - Waves

## Wave Motion

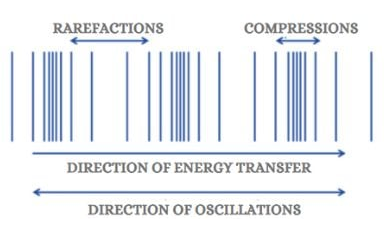
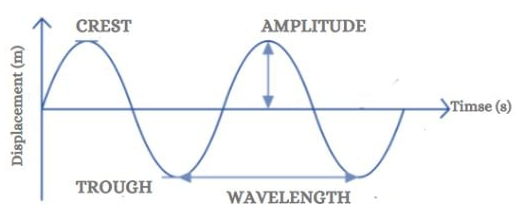
Waves transfer energy from one place to another without any net transfer of matter. These can be longitudinal or transverse:

<table border="1" id="bkmrk-longitudinal-maxima-" style="border-collapse: collapse; width: 100%;"><colgroup><col style="width: 16.7263%;"></col><col style="width: 83.3929%;"></col></colgroup><tbody><tr><td>Longitudinal</td><td>- Maxima at compressions and minima at rarefactions.
- Particles move parallel to the direction of energy travel.
- 

[![image.png](https://bookstack.asadhussain.net/uploads/images/gallery/2026-02/scaled-1680-/iOZimage.png)](https://scienceinfo.com/difference-between-transverse-and-longitudinal-wave/)
</td></tr><tr><td>Transverse</td><td>- Maxima at peaks and minima at troughs.
- Particles move perpendicular to the direction of energy travel.
- E.g. electromagnetic waves.

[![image.png](https://bookstack.asadhussain.net/uploads/images/gallery/2026-02/scaled-1680-/N3Pimage.png)](https://scienceinfo.com/difference-between-transverse-and-longitudinal-wave/)
</td></tr></tbody></table>

Waves that move away from a source are called progressive waves. However, this regards only the movement of **energy** - particles oscillate in place.

## Wave Terminology

<table border="1" id="bkmrk-displacement-the-dis" style="border-collapse: collapse; width: 100%;"><colgroup><col style="width: 50%;"></col><col style="width: 50%;"></col></colgroup><tbody><tr><td>Displacement</td><td>The distance traveled by a wave from its rest position.</td></tr><tr><td>Amplitude</td><td>The maximum displacement of oscillating particles in a wave.</td></tr><tr><td>Wavelength</td><td>The distance between two successive identical points of a wave.</td></tr><tr><td>Time period</td><td>The time taken for a wave to complete one pattern of oscillation.</td></tr><tr><td>Frequency</td><td>The number of oscillations at any point per unit time. Reciprocal of time period.</td></tr><tr><td>Phase difference</td><td>A measure of the difference in pattern of oscillation between two points of a wave. Measured in radians from 0 to 2pi.</td></tr><tr><td>Path difference</td><td>The difference between the distances traveled by two waves arriving at the same point. Usually measured in terms of wavelength, as path difference resets to 0m at a path difference equal to one wavelength.</td></tr></tbody></table>

## Oscilloscopes

An oscilloscope displays a voltage-time signal. It can be used to measure the output from a microphone or signal generator.

Each horizontal division represents a unit of time. The unit of time per division is determined with the time base - e.g. 0.002 s/div. This can help you determine time period.

Each vertical division represents a unit of voltage. The unit of voltage per division is determined with the sensitivity - e.g. 20 V/div (less sensitive) to 5 mV/div (far more sensitive). The more sensitive, the easier it is to determine the precise points where the wave crosses the axis, as the slope appears steeper and the peaks are more defined. However, it also increases the risk of the signal moving off-screen.

## Wave Equations

[![image.png](https://bookstack.asadhussain.net/uploads/images/gallery/2026-02/scaled-1680-/G7Fimage.png)](https://bookstack.asadhussain.net/uploads/images/gallery/2026-02/G7Fimage.png)

... where v is wave velocity, f is wave frequency, and lambda is wave wavelength. For EM waves in a vacuum, v = 3.00e8. For sound waves, v = 330.

[![image.png](https://bookstack.asadhussain.net/uploads/images/gallery/2026-02/scaled-1680-/N2Uimage.png)](https://bookstack.asadhussain.net/uploads/images/gallery/2026-02/N2Uimage.png)

... where I is the wave intensity (Wm<sup>-2</sup>), P is the wave power, and A is the surface area of the source (e.g. 4<span class="ZNx93QP1XNrBdT5MI6SY"><span class="expandableItem">π</span></span>r<sup>2</sup> for a sphere like the Sun).

Wave intensity is defined as the rate at which energy is transferred from one location to another as the wave travels through space. **It is proportional to the square of its amplitude** - e.g. if the amplitude decreases by a factor of 2, intensity reduces by a factor of **2<sup>2</sup> = 4**.

## EM Spectrum

Waves in the EM spectrum are transverse waves that can travel through a vacuum. They all have a magnetic and an electrical wave interlocked and at right angles to each other. In a vacuum, they travel at c = 2.98e8 ms<sup>-1</sup>.

<table border="1" id="bkmrk-wave-wavelength-%2F-m-" style="border-collapse: collapse; width: 51.4286%;"><colgroup><col style="width: 25.057%;"></col><col style="width: 33.6382%;"></col><col style="width: 41.5329%;"></col></colgroup><tbody><tr><td>**Wave**</td><td>**Wavelength / m**</td><td>**Frequency / Hz**</td></tr><tr><td>Radio</td><td>1e-1 to 1e4</td><td>3e4 to 3e9</td></tr><tr><td>Microwave</td><td>1e-4 to 1e-1</td><td>3e9 to 3e12</td></tr><tr><td><span style="background-color: rgb(191, 237, 210);">Infrared</span></td><td><span style="background-color: rgb(191, 237, 210);">7.4e-7 to 1e-3</span></td><td><span style="background-color: rgb(191, 237, 210);">3e11 to 4e14</span></td></tr><tr><td><span style="background-color: rgb(191, 237, 210);">Visible light</span></td><td><span style="background-color: rgb(191, 237, 210);">3.7e-7 to 7.4e-7</span></td><td><span style="background-color: rgb(191, 237, 210);">4e14 to 8e14</span></td></tr><tr><td><span style="background-color: rgb(191, 237, 210);">Ultra violet</span></td><td><span style="background-color: rgb(191, 237, 210);">1e-9 to 3.7e-7</span></td><td><span style="background-color: rgb(191, 237, 210);">8e14 to 3e17</span></td></tr><tr><td><span style="background-color: rgb(248, 202, 198);">X-Rays</span></td><td><span style="background-color: rgb(248, 202, 198);">1e-12 to 1e-7</span></td><td><span style="background-color: rgb(248, 202, 198);">3e15 to 3e20</span></td></tr><tr><td><span style="background-color: rgb(248, 202, 198);">Gamma rays</span></td><td><span style="background-color: rgb(248, 202, 198);">1e-16 to 1e-9</span></td><td><span style="background-color: rgb(248, 202, 198);">3e17 to 3e24</span></td></tr></tbody></table>

Ionising EM radiation has photons with sufficient energy to knock electrons from the shells of atoms.

99% of UV radiation is classified as UV-A, which is non-ionising. UV-B and UV-C are ionising, but UV-C is filtered out by the Earth's atmosphere, and the ionising nature of UV-B is mitigated using sunscreen creams.

## Properties of Waves

<table border="1" id="bkmrk-reflection-when-a-wa" style="border-collapse: collapse; width: 100%;"><colgroup><col style="width: 14.1072%;"></col><col style="width: 86.012%;"></col></colgroup><tbody><tr><td>Reflection</td><td>When a wave bounces off a surface.</td></tr><tr><td>Refraction</td><td>When a wave moves from one material into another of a different density, causing the wave to change speed and bend (unless traveling along the normal). Can be seen in glasses.</td></tr><tr><td>Diffraction</td><td>When a wave passes through an aperture that has a separation similar to the wave's wavelength, causing it to change direction.</td></tr><tr><td>Interference</td><td>When two or more waves overlap at a point, which has a particle displacement equal to the algebraic sum of all of the involved waves' displacements.</td></tr></tbody></table>

## Light Refraction

Refraction occurs when a wave moves from one material into another of a different density, causing the wave to change speed and bend (unless traveling along the normal).

Every material has a refractive index. The higher this index, the stronger the effect of refraction. The refractive index is given as:

[![image.png](https://bookstack.asadhussain.net/uploads/images/gallery/2026-02/scaled-1680-/LWwimage.png)](https://bookstack.asadhussain.net/uploads/images/gallery/2026-02/LWwimage.png)

... where v is the speed of the wave in the medium.

### Snell's Law

The refractive index also determines the angle at which a wave refracts, given by:

[![image.png](https://bookstack.asadhussain.net/uploads/images/gallery/2026-02/scaled-1680-/JZFimage.png)](https://bookstack.asadhussain.net/uploads/images/gallery/2026-02/JZFimage.png)

[![image.png](https://bookstack.asadhussain.net/uploads/images/gallery/2026-02/scaled-1680-/68Aimage.png)](https://bookstack.asadhussain.net/uploads/images/gallery/2026-02/68Aimage.png)

### Total internal reflection

This occurs when the angle of refraction (theta 2) is greater than or equal to 90 degrees. The incident angle causing a refracted angle of 90 degrees is known as the critical angle - any incident angle greater than this causes TIR. Take air and water for an example:

[![image.png](https://bookstack.asadhussain.net/uploads/images/gallery/2026-02/scaled-1680-/60Rimage.png)](https://bookstack.asadhussain.net/uploads/images/gallery/2026-02/60Rimage.png)

The critical angle is determined using:

[![image.png](https://bookstack.asadhussain.net/uploads/images/gallery/2026-02/scaled-1680-/53himage.png)](https://bookstack.asadhussain.net/uploads/images/gallery/2026-02/53himage.png)

## Polarisation

Serves as good evidence for the wave nature of light (on the particle nature, look at **4.5 - Quantum Physics**). All transverse waves can be polarised.

Light emitted from a source is unpolarised by default - the electric field of EM waves can be in any number of planes. Some crystalline materials can cause the oscillating fields to happen in only one plane. A wave with fields only one plane is known as plane polarised.

### Malus' Law

When a perfect polarising filter is put in front of a polarising wave with the vertical at an angle theta to the plane, the intensity of the output is:

[![image.png](https://bookstack.asadhussain.net/uploads/images/gallery/2026-02/scaled-1680-/Dqdimage.png)](https://bookstack.asadhussain.net/uploads/images/gallery/2026-02/Dqdimage.png)

## Interference and Superposition

The principle of superposition states that when two or more waves of the same type meet, the resultant wave can be found by adding the displacements of the individual waves.

[![image.png](https://bookstack.asadhussain.net/uploads/images/gallery/2026-02/scaled-1680-/OPkimage.png)](https://bookstack.asadhussain.net/uploads/images/gallery/2026-02/OPkimage.png)

Coherent waves have a constant frequency, and thus a constant phase difference.

With two waves in phase (path difference a multiple of lambda; phase difference 0 or a multiple of 2pi), total constructive interference occurs. This means the resultant wave has an increased amplitude.

With two waves out of phase (path difference an odd multiple of 1/2 lambda; phase difference an odd multiple of pi), total destructive interference occurs. This means the resultant wave has an amplitude of 0m.

In sound/spreading waves instead of waves in a linear path:

[![image.png](https://bookstack.asadhussain.net/uploads/images/gallery/2026-02/scaled-1680-/1qhimage.png)](https://bookstack.asadhussain.net/uploads/images/gallery/2026-02/1qhimage.png)

### Young's Double-Slit Experiment

Involves the emission of monochromatic light waves with wavelength lambda leaving a source and entering two slits with separation "a", causing diffraction. The diffracted waves travel a perpendicular distance "D" from the slits and superpose, constructively and destructively interfering to form fringes with separation "x" between maxima:

[![image.png](https://bookstack.asadhussain.net/uploads/images/gallery/2026-02/scaled-1680-/RoTimage.png)](https://bookstack.asadhussain.net/uploads/images/gallery/2026-02/RoTimage.png)

[![image.png](https://bookstack.asadhussain.net/uploads/images/gallery/2026-02/scaled-1680-/veWimage.png)](https://www.slideserve.com/tehya/young-s-double-slit-experiment)

[![image.png](https://bookstack.asadhussain.net/uploads/images/gallery/2026-02/scaled-1680-/eYGimage.png)](https://physics.stackexchange.com/questions/138625/double-slit-experiment-separation-between-fringes)

### Diffraction gratings

A diffraction grating is a piece of optical equipment made from glass, onto which hundreds/thousands of very thin, parallel, and equally spaced grooves have been accurately engraved. Measured in lines per mm. This greatly increases the resolution of interference patterns, which increases with number of slits. As you can see in the above image, a double slit pattern has much clearer fringe separations than the single slit pattern. Different orders of fringe are visible at path differences equal to multiples of lambda depending on slit separation, which define where fringes are visible - e.g.:

[![image.png](https://bookstack.asadhussain.net/uploads/images/gallery/2026-02/scaled-1680-/DHjimage.png)](https://bookstack.asadhussain.net/uploads/images/gallery/2026-02/DHjimage.png)

[![image.png](https://bookstack.asadhussain.net/uploads/images/gallery/2026-02/scaled-1680-/jZZimage.png)](https://bookstack.asadhussain.net/uploads/images/gallery/2026-02/jZZimage.png)

... where n is the order of the maximum (1, 2, 3), lambda is the wavelength of light, d is slit separation, and theta is the angle between the beam and the grating.

### Stationary Waves

Stationary waves are produced by interference in accordance with the principle of superposition. Two waves must be coherent, have roughly the same amplitude, and be traveling in opposite directions. Nodes are points of zero amplitude, where waves undergo destructive interference. Antinodes are points of maximum amplitude, where waves undergo constructive interference. Adjacent nodes and adjacent antinodes have a separation equal to half the wavelength.

#### Harmonics

Depending on the frequency of the stationary wave, it may have a different mode of harmonic:

[![image.png](https://bookstack.asadhussain.net/uploads/images/gallery/2026-02/scaled-1680-/ftqimage.png)](https://bookstack.asadhussain.net/uploads/images/gallery/2026-02/ftqimage.png)

#### Longitudinal Waves

In tubes, there is always a node at the closed end, and an antinode at an open end. This makes the fundamental and nth harmonics look different:

[![image.png](https://bookstack.asadhussain.net/uploads/images/gallery/2026-02/scaled-1680-/ERyimage.png)](https://bookstack.asadhussain.net/uploads/images/gallery/2026-02/ERyimage.png)

[![image.png](https://bookstack.asadhussain.net/uploads/images/gallery/2026-02/scaled-1680-/1xWimage.png)](https://bookstack.asadhussain.net/uploads/images/gallery/2026-02/1xWimage.png)

# 4.5 - Quantum Physics

## Photons

A quantum (plural: quanta) is a small discrete unit of energy.

A photon is a quantum of EM radiation.

Photon energies are always emitted in multiples of the Planck constant, h = 6.63e-34. Photon energy in joules is determined using:

[![image.png](https://bookstack.asadhussain.net/uploads/images/gallery/2026-02/scaled-1680-/KECimage.png)](https://bookstack.asadhussain.net/uploads/images/gallery/2026-02/KECimage.png)

These energies can also be expressed in electronvolts by dividing the energy in joules by e=1.6e-19. One electronvolt is defined as the kinetic energy gained by an electron when it is accelerated through a potential difference of 1V.

## The Photoelectric Effect

Each electron can only absorb one photon. This is known as the one-to-one relationship between electrons and photons.

Every metallic surface has a work function phi, which defines the minimum energy required for an electron to overcome electrostatic attraction between it and the metal cations, enabling it to be released/liberated from the metal surface. This energy can be obtained by absorbing a photon:

[![image.png](https://bookstack.asadhussain.net/uploads/images/gallery/2026-02/scaled-1680-/Adgimage.png)](https://bookstack.asadhussain.net/uploads/images/gallery/2026-02/Adgimage.png)

... where hf is the energy of the photon, phi is the work function, and KE<sub>max</sub> is the maximum additional energy from the photon transferred to the photoelectron's kinetic energy store. There is a maximum additional energy, as it is not the case that all photons from the same source have the same energy.

As light frequency is directly proportional to photon energy, the frequency of the EM radiation incident on a metal surface can affect whether or not electrons are liberated. This means a metal surface can also have a **threshold frequency**.

However, light intensity does **not** affect electron liberation - it only affects the number of photons released from the radiation source. For radiation above the threshold frequency, however, the rate of emission of photoelectrons is directly proportional to radiation intensity.

The photoelectric effect can be demonstrated using a gold leaf setup:

[![image.png](https://bookstack.asadhussain.net/uploads/images/gallery/2026-02/scaled-1680-/1qjimage.png)](https://bookstack.asadhussain.net/uploads/images/gallery/2026-02/1qjimage.png)

1. The electroscope is negatively charged, causing the brass stem and gold leaf to be negatively charged, repelling each other, causing the gold leaf to rise.
2. EM radiation above the threshold frequency is incident on the metal cap.
3. Electrons are liberated from the surface.
4. Electrons are transferred from the brass stem and gold leaf to the metal cap.
5. The reduction in strength of like negative charge reduces the electrostatic repulsion between the gold leaf and stem.
6. The gold leaf falls.

### Circuit setup

[![image.png](https://bookstack.asadhussain.net/uploads/images/gallery/2026-02/scaled-1680-/G2Gimage.png)](https://bookstack.asadhussain.net/uploads/images/gallery/2026-02/G2Gimage.png)

The stopping potential is the specific negative voltage applied to the collector plate that provides just enough electrical work to cancel out the maximum kinetic energy of the incoming photoelectrons, bringing them to rest exactly at the plate's surface. This can be determined by rearranging the following equation into the form y = mx + c:

[![image.png](https://bookstack.asadhussain.net/uploads/images/gallery/2026-02/scaled-1680-/f03image.png)](https://bookstack.asadhussain.net/uploads/images/gallery/2026-02/f03image.png)

<table border="1" id="bkmrk-%5Craggedright%7B-%5Ctext%7B" style="border-collapse: collapse; width: 100%;"><colgroup><col style="width: 99.881%;"></col></colgroup><tbody><tr><td>\\raggedright{

\\text{We know:}\\\\

  
KE\_{max} = eV\_s\\\\  
E = hf\\\\  
hf = \\phi + KE\_{max}\\\\

\\text{So:}\\\\

  
hf = \\phi + eV\_s\\\\  
V\_s = \\frac{h}{e}f - \\frac{\\phi}{e}

}

</td></tr></tbody></table>

Plotting a graph of stopping potential against radiation frequency can enable one to determine the value of h using the gradient multiplied by e = 1.6e-19.

## Wave-Particle Duality

This concept describes the idea that light, other types of EM radiation, and even matter could behave as both a wave and a stream of particles.

This can be observed by de Broglie's experiment involving the firing of electrons at a layer of graphite behind a screen. The result is concentric rings of alternating intensity:

[![image.png](https://bookstack.asadhussain.net/uploads/images/gallery/2026-02/scaled-1680-/FzCimage.png)](https://bookstack.asadhussain.net/uploads/images/gallery/2026-02/FzCimage.png)

This showed that electrons could diffract and interfere constructively and destructively. However, this was thought to be a behavior exclusive to waves.

The (de Broglie) wavelength of a particle can be determined with:

[![image.png](https://bookstack.asadhussain.net/uploads/images/gallery/2026-02/scaled-1680-/yGUimage.png)](https://bookstack.asadhussain.net/uploads/images/gallery/2026-02/yGUimage.png)

You can also substitute:

[![image.png](https://bookstack.asadhussain.net/uploads/images/gallery/2026-02/scaled-1680-/6Vnimage.png)](https://bookstack.asadhussain.net/uploads/images/gallery/2026-02/6Vnimage.png)

Wavelength is inversely proportional to mass. Since a wavelength similar to aperture size is required for diffraction, you wouldn't see a human diffracting walking through a door, for example. Assuming a mass 75kg and velocity 1ms<sup>-1</sup>:

[![image.png](https://bookstack.asadhussain.net/uploads/images/gallery/2026-02/scaled-1680-/GJLimage.png)](https://bookstack.asadhussain.net/uploads/images/gallery/2026-02/GJLimage.png)

... which is nowhere close to the width of any human's body, let alone the width of a doorway.

# Module 5

# Cosmology

## Structure of the Universe

Galaxies are clusters of millions and billions of stars. They are constantly moving due to the expansion of the universe. The further they are - i.e. closer to the edge of the universe - the faster they move.

Stars are spheres of interstellar matter that undergo nuclear fusion.

Planets are bodies that move in elliptical orbits around a star to form a solar system. They are less dense than stars.

Planetary satellites are bodies that move in elliptical orbits around a planet. An example is the moon of Earth.

## Star formation and life cycle

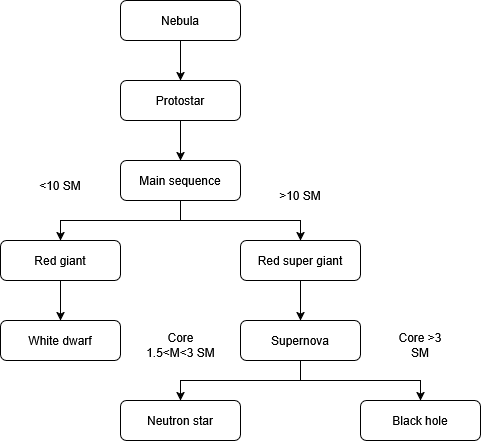
- <div drawio-diagram="161"><img src="https://bookstack.asadhussain.net/uploads/images/drawio/2026-05/drawing-3-1778084681.png" alt=""/></div>

### Nebula and Protostar

A nebula is a cloud of interstellar matter composed of various elements such as hydrogen and helium. They exert gravitational force on each other, causing a dense sphere to be created from gathered matter.

This sphere is a protostar. A protostar is a small, dense sphere of interstellar matter that does not yet undergo nuclear fusion. As it gets larger, temperature and pressure increases, enabling nuclear fusion to begin. This transitions to the next phase: main sequence.

### Main Sequence Star

A main sequence star is a sphere of interstellar matter that undergoes nuclear fusion. It is of a temperature where it primarily fuses hydrogen nuclei (protons) into helium nuclei.

When hydrogen runs out, the star transitions to the next phase: red (super) giant.

### Red Giant

A red giant is a sphere of interstellar matter that undergoes nuclear fusion of larger elements like helium, all the way up to, and excluding, iron. This occurs due to gravitational collapse after main sequence - hydrogen is no longer being fused, so the outward pressure caused by fusion decreases, causing the star to succumb to gravitational pressure. At a low volume, the massive density causes temperature and pressure to increase to the point where nuclear fusion of these larger elements can occur.

If the main sequence star after all fuel consumption is less than 10 solar masses, it transitions into a red giant. If greater, it transitions into a red super giant (a larger red giant).

After these elements run out again, the star transitions into the next stage depending on the mass of the **core** of what is left.

### White Dwarf

A red giant will always transition into a white dwarf. The Chandrasekhar limit states that the maximum mass for a white dwarf is 1.44 solar masses.

### Supernova

The outer layers of the super red giant collapse into the core and bounce off, resulting in a blast that sends the material of these outer layers into space. The scattered material can form part of nebulae, being part of the birth of a new star.

What happens next depends on the mass of the remaining core of the super red giant.

#### Neutron Star

If the mass of the core is between 1.5 and 3 solar masses, it collapses into a neutron star. This is due to the gravitational pressure bringing atoms closer together, to the point where electrons collide with protons to form neutrons.

#### Black Hole

If the mass of the core is greater than 3 solar masses, it continues collapsing into itself, creating a black hole. This has a gravitational force so strong, even light cannot escape it.

## EM radiation from stars

Electrons occupy certain orbits in atoms, and these orbits are associated with definite energies and are known as energy levels. When electrons gain energy, they move up a level. When they go down a level, lost energy is emitted as a photon with an energy equal to the difference in energy of the energy levels. The frequency of this photon is dictated by E=hf.

1. Emission line spectra are produced in cooling hot gas of an element, when an excited electron moves down an energy level and emits a photon. The energies and frequencies of these photons, along with abundances, are plotted on a spectrum in lines on a dark background. The spacing between these lines is proportional to the spacing between energy levels. Since the spacing of energy levels is unique to each element, each element has its own emission spectrum.
2. Absorption line spectra are produced in firing EM radiation into cold gas of an element, when photons of certain energies are absorbed by atoms of this element, causing electrons to move up an energy level. Thus, these absorbed photons do not pass through. Instead of a black background, this is presented as black lines on a rainbow background where photons of that frequency (as per E=hf) have been absorbed.

Outputs of the above two methods are passed through a diffraction grating to display the spectrum on a screen. The wavelength of the light source can be calculated using:

[![image.png](https://bookstack.asadhussain.net/uploads/images/gallery/2026-05/scaled-1680-/cLnimage.png)](https://bookstack.asadhussain.net/uploads/images/gallery/2026-05/cLnimage.png)

... where n is the order of the maximum, lambda is the wavelength, d is the distance between diffraction grating lines, and theta is the angle between the output beam and the grating.

## Wien's law

Wien's displacement law states that:

[![image.png](https://bookstack.asadhussain.net/uploads/images/gallery/2026-05/scaled-1680-/Kqfimage.png)](https://bookstack.asadhussain.net/uploads/images/gallery/2026-05/Kqfimage.png)

... where lambda\_{max} is peak emitted wavelength, and T is temperature. It is used to estimate the peak surface temperature of a star from the wavelength at which the star's brightness is maximum. However, the Earth's atmosphere can block certain wavelengths, reducing their intensity, and pollution can block EM radiation. Thus, telescopes are places at high altitudes and even in Earth's orbit. Also, some detectors may be less responsive to certain wavelengths.

Stefan's law states that:

[![image.png](https://bookstack.asadhussain.net/uploads/images/gallery/2026-05/scaled-1680-/auMimage.png)](https://bookstack.asadhussain.net/uploads/images/gallery/2026-05/auMimage.png)

... where L is luminosity, r is distance to the object, sigma is Stefan's constant 5.67e-8, and T is temperature.

## Stefan's law

## Astronomical distances

The astronomical unit (AU) is the distance between the centre of the Earth and the centre of the Sun.

One light year is the amount of distance travelled by light in one year. About 9.5e+15m.

One parsec is the distance of a star from Earth when the angle of parallax subtended by the radius of the Earth's orbit is 1 arc second (1/3600th of a degree). This is about 3.1e+16m.

Stellar parallax is the apparent shifting in position of a star viewed in a background of distant stars when viewed from different positions on the Earth

\[Diagram of parallax setup to view a star\]

Scientists take an image of the star from one observation point in January, then another 6 months later in June. Since 6 months pass, the Earth travelled 2AU about the sun. This is a base of a triangle used in this calculation. The angle 2p is determined with telescopic imaging. This is divided by 2 to get an angle p. This is used in the equation:

[![image.png](https://bookstack.asadhussain.net/uploads/images/gallery/2026-05/scaled-1680-/CJ2image.png)](https://bookstack.asadhussain.net/uploads/images/gallery/2026-05/CJ2image.png)

... where d is distance to the star in parsecs.

## The Doppler effect

The Doppler effect is the apparent change in wavelength caused by the relative motion between the wave source and an observer.

[![image.png](https://bookstack.asadhussain.net/uploads/images/gallery/2026-05/scaled-1680-/zG6image.png)](https://sciencenotes.org/doppler-effect-definition-formula-and-examples/)

When the moving object moves towards the object, the observed frequency is greater. When away, it's observed as lower.

[![image.png](https://bookstack.asadhussain.net/uploads/images/gallery/2026-05/scaled-1680-/niSimage.png)](https://bookstack.asadhussain.net/uploads/images/gallery/2026-05/niSimage.png)

... where v is the velocity of the galaxy relative to Earth. For distances from galaxies, the difference in wavelength/frequency is taken between the known hydrogen line spectrum and that of the observed galaxies.

The Doppler effect was observed by Edwin Hubble in 1929. He noticed the differences in hydrogen line spectra from different galaxies compared to the known hydrogen line spectrum and concluded that galaxies are constantly moving - not only that, but the largest majority of them are moving away from us. He also noticed that galaxies further from us moved faster than those closer to us. This is expressed in his equation:

[![image.png](https://bookstack.asadhussain.net/uploads/images/gallery/2026-05/scaled-1680-/YBiimage.png)](https://bookstack.asadhussain.net/uploads/images/gallery/2026-05/YBiimage.png)

... where v is velocity, D is distance to a galaxy, and H\_0 is Hubble's constant, which is estimated to be 2.27e-18 s^{-1}. The reciprocal of Hubble's constant corresponds to the age of the universe.

The observation evidences the universe's expansion - specifically, the expansion of space between galaxies. Like drawing dots on a deflated balloon and inflating it: the space between dots expands, but the dots aren't technically moving. This leads onto dark matter and dark energy.

## Dark matter and dark energy

When calculating the universe's density, we use two methods to estimate their mass: luminosity of distant galaxies; or speed of their rotation. However, values from both of these methods have massive discrepancies, with the latter method showing far more mass. This suggests that there is an invisible form of matter that accounts for the missing mass. This is hypothesised to be dark matter, which accounts for approximately 27% of the universe. It is responsible for providing the gravitational force required to form galaxies and keep them from flying apart.

Dark energy is a material with a gravitationally repulsive effect that causes negative pressure, causing the acceleration of the universe's expansion. This is why the majority of galaxies are moving away from us - the force from dark energy is greater than the gravitational pull between the Milky Way and the other galaxies. The rare exceptions, such as the Andromeda galaxy, are due to the gravitational force between us and them being greater than the force provided by dark matter.

\[For dark energy, unsure if "force" is the correct word to be used.\]

## CMBR and the cosmological principle

The cosmological principle states that on a large scale the universe is isotropic and homogeneous, and the laws of physics apply everywhere.

- Isotropic: The same in all directions.
- Homogeneous: Of uniform density throughout.

Cosmic microwave background radiation (CMBR) is radiation that was released at the time of the Big Bang. Over billions of years as the universe expanded, the radiation expanded. The increase in wavelength puts CMBR in the microwave part of the EM spectrum, and its intensity is equal everywhere in the universe.

## Evolution of the universe

1. The universe was contained in a singularity of incredible pressure and temperature of 10e+22K.  
    For an unknown reason, this singularity began to expand in a period known as inflation. During and after inflation, matter and antimatter (in an uneven ratio of abundance) formed from the energy in the form of quarks, leptons, all their antimatter variants, and photons. Hadrons and baryons still couldn't form from the quarks since the temperatures were still far to large. Matter and antimatter annihilated, and still do, resulting in the production of multiple high-energy photons.  
    After this, the universe cooled down to 10e+12K, so quarks could join to produce hadrons, but these hadrons could not combine to create atoms yet, as temperatures were still too high.
2. **100 seconds after inflation,** the universe cooled to 10e+9K, low enough for protons (hydrogen nuclei) to form to fuse into helium and lithium nuclei. All matter was in plasma form - i.e. protons and electrons are not bound to one another due to high temperature. The composition of the universe was majority hydrogen at this point.
3. **250,000 years after inflation,** the universe cooled to 10,000K, low enough for a process called decoupling to occur, whereby radiation and matter could decouple. This enabled electrons to bind with nuclei to form atoms - specifically, hydrogen, helium, and lithium atoms. Since photons could now move more freely, the universe became transparent. The radiation here became the CMBR we observe today.
4. **1e+6 years after inflation,** the temperature cooled to 6000K. This is when galaxies started to form.
5. **1e+9 years after inflation,** the universe cooled to 17K. Stars that underwent gravitational collapse formed heavy elements.
6. **13.7e+9 years after inflation (now),** the universe cooled to 2.7K. This is present day.

# Thermal Physics

## Temperature

Thermal equilibrium describes the equal transfer of thermal energy in and out of a system.

The absolute scale of temperature is Kelvin. You convert from Celsius to Kelvin by adding 273 to the Celsius number. This is because -273 Celsius (0K) is absolute zero, which is the theoretical lowest possible temperature at which particles have an internal energy of 0J, causing zero movement and zero pressure.

## Solids, Liquids, and Gases

<table border="1" id="bkmrk-" style="border-collapse: collapse; width: 100%; height: 268.2px;"><colgroup><col style="width: 25%;"></col><col style="width: 25%;"></col><col style="width: 25%;"></col><col style="width: 25%;"></col></colgroup><thead><tr style="height: 29.8px;"><td style="height: 29.8px;">**Property**</td><td style="height: 29.8px;">**Solid**</td><td style="height: 29.8px;">**Liquid**</td><td style="height: 29.8px;">**Gas**</td></tr></thead><tbody><tr style="height: 29.8px;"><td style="height: 29.8px;">Shape</td><td style="height: 29.8px;">Definite shape.</td><td style="height: 29.8px;">Indefinite shape (depends on container).</td><td style="height: 29.8px;">Indefinite shape (depends on container).</td></tr><tr style="height: 29.8px;"><td style="height: 29.8px;">Volume</td><td style="height: 29.8px;">Definite volume.</td><td style="height: 29.8px;">Definite volume.</td><td style="height: 29.8px;">Indefinite volume (depends on container).</td></tr><tr style="height: 29.8px;"><td style="height: 29.8px;">Particle arrangement</td><td style="height: 29.8px;">Particles are fixed close together in a regular lattice. (Edge case exceptions like glass, where they are arranged in an irregular lattice.)</td><td style="height: 29.8px;">Particles are close together, but not in a regular lattice - rather, in a random arrangement.</td><td style="height: 29.8px;">Particles are very far apart in a random arrangement.</td></tr><tr style="height: 29.8px;"><td style="height: 29.8px;">Particle movement</td><td style="height: 29.8px;">Particles vibrate in place.</td><td style="height: 29.8px;">Particles are constantly moving close to each other, flowing over other particles.</td><td style="height: 29.8px;">Particles are constantly moving in straight lines in directions influenced by collisions with other particles.</td></tr><tr style="height: 29.8px;"><td style="height: 29.8px;">Intermolecular forces</td><td style="height: 29.8px;">Strong.</td><td style="height: 29.8px;">Moderate.</td><td style="height: 29.8px;">Weak, often negligible.</td></tr><tr style="height: 29.8px;"><td style="height: 29.8px;">Compressibility</td><td style="height: 29.8px;">Almost incompressible.</td><td style="height: 29.8px;">Almost incompressible.</td><td style="height: 29.8px;">Highly compressible.</td></tr><tr style="height: 29.8px;"><td style="height: 29.8px;">Fluidity</td><td style="height: 29.8px;">Cannot flow.</td><td style="height: 29.8px;">Flows easily.</td><td style="height: 29.8px;">Flows easily.</td></tr><tr style="height: 29.8px;"><td style="height: 29.8px;">Density</td><td style="height: 29.8px;">Generally high.</td><td style="height: 29.8px;">Generally moderate.</td><td style="height: 29.8px;">Generally very low.</td></tr></tbody></table>

[![image.png](https://bookstack.asadhussain.net/uploads/images/gallery/2026-05/scaled-1680-/C5Nimage.png)](https://reviewston.com/chemistry-guide/physical-chemistry/kinetic-particle-theory/what-is-kinetic-particle-theory/)

Internal energy is defined as the sum of the random distribution of kinetic and potential energies of all molecules in a system.

Potential energy is defined as the energy stored within a system due to the relative positions and intermolecular forces between molecules in a system.

When the temperature around a material increases, there is a positive temperature gradient, so thermal energy from the surroundings transfers to the kinetic energy stores of its particles, increasing its internal energy. This enables it to change state from solid to liquid (melting) to gas (evaporating).

Conversely, reduction of temperature causes a negative temperature gradient, so the opposite happens, causing a change in state from gas to liquid (condensing) to solid (freezing).

During a change in state, the temperature of the material remains constant, so kinetic energy doesn't change. However, due to the increased spacing between particles, potential energy becomes less negative, so internal energy increases regardless.

### Specific Heat Capacity

Specific heat capacity is the amount of energy to increase the temperature of 1 unit mass of a substance by 1 unit of temperature. It is calculated with:

[![image.png](https://bookstack.asadhussain.net/uploads/images/gallery/2026-05/scaled-1680-/rHWimage.png)](https://bookstack.asadhussain.net/uploads/images/gallery/2026-05/rHWimage.png)

... where delta Q is the change in energy, m is the mass, c is the specific heat capacity, and delta T is the change in temperature.

### Specific Latent Heat

Specific latent heat is the amount of energy required to change the state of 1 unit mass of a substance. It is calculated with:

[![image.png](https://bookstack.asadhussain.net/uploads/images/gallery/2026-05/scaled-1680-/XCrimage.png)](https://bookstack.asadhussain.net/uploads/images/gallery/2026-05/XCrimage.png)

... where Q is energy, m is mass, and L is specific latent heat.

## Brownian Motion

Brownian motion describes the observed random motion of particles suspended in a fluid due to the bombardment of smaller particles.

## Amount of Substance

The mole is a unit used to measure the amount of a substance. Each mole of a substance contains 6.02e+23 atoms. From this, mass and mass/mol can be calculated using the formula:

[![image.png](https://bookstack.asadhussain.net/uploads/images/gallery/2026-05/scaled-1680-/B8qimage.png)](https://bookstack.asadhussain.net/uploads/images/gallery/2026-05/B8qimage.png)

... where n is amount of substance, m is mass, and Mr is mass per unit amount.

## The Kinetic Theory

The kinetic model of matter dictates the motion of particles in an ideal gas. Real gases behave similarly to an ideal gas in low pressures and high temperatures significantly above their boiling points. The behavior of an ideal gas has multiple assumptions:

- The gas contains a large number of molecules.
- Particles move randomly and rapidly.
- All collisions are perfectly elastic (kinetic energy is perfectly conserved).
- The forces between particles are negligible, apart from collisions. As such, the internal energy is equal to the random distribution of kinetic energies of all particles in the gas, as it is assumed that potential energy is negligible.
- The time for a collision to happen is negligible to the time between collisions.
- Particles have a negligible volume compared to the volume of the container they're in.

With all these assumptions, an equation can be made for an ideal gas in a container:

[![image.png](https://bookstack.asadhussain.net/uploads/images/gallery/2026-05/scaled-1680-/Qttimage.png)](https://bookstack.asadhussain.net/uploads/images/gallery/2026-05/Qttimage.png)

... where P is pressure, V is volume, n is amount of gas, R is the ideal gas constant, and T is temperature.

The root mean square speed of a gas, c\_rms, is the square root of the mean of the squares of all velocities of particles in an ideal gas:

[![image.png](https://bookstack.asadhussain.net/uploads/images/gallery/2026-05/scaled-1680-/CNMimage.png)](https://bookstack.asadhussain.net/uploads/images/gallery/2026-05/CNMimage.png)

It is known that:

[![image.png](https://bookstack.asadhussain.net/uploads/images/gallery/2026-05/scaled-1680-/VyMimage.png)](https://bookstack.asadhussain.net/uploads/images/gallery/2026-05/VyMimage.png)

... where p is pressure, V is volume, N is the number of particles, m is mass of a particle, and c bar squared is the mean square speed.

## Investigating Gases

Boyle's law states that the product of the pressure and volume of an ideal gas in a container is constant regardless of how pressure and volume are modified.

[![image.png](https://bookstack.asadhussain.net/uploads/images/gallery/2026-05/scaled-1680-/Aa4image.png)](https://bookstack.asadhussain.net/uploads/images/gallery/2026-05/Aa4image.png)

... where bases of 1 and 2 represent values of pressure and volume before and after modification of one of the variables.

The pressure-temperature law is similar, but states that the ratio of pressure to temperature is constant regardless of how pressure and temperature are modified.

[![image.png](https://bookstack.asadhussain.net/uploads/images/gallery/2026-05/scaled-1680-/LyOimage.png)](https://bookstack.asadhussain.net/uploads/images/gallery/2026-05/LyOimage.png)

On a graph of pressure against temperature, the x-intercept marks the value of absolute zero, as a temperature of 0K means that particles have no energy, so they don't move, so no pressure is exerted.

Charles' law is also similar, but relates to the ratio of volume to temperature:

[![image.png](https://bookstack.asadhussain.net/uploads/images/gallery/2026-05/scaled-1680-/zphimage.png)](https://bookstack.asadhussain.net/uploads/images/gallery/2026-05/zphimage.png)

Combining this gives:

[![image.png](https://bookstack.asadhussain.net/uploads/images/gallery/2026-05/scaled-1680-/l2Qimage.png)](https://bookstack.asadhussain.net/uploads/images/gallery/2026-05/l2Qimage.png)

... where PV/T is directly proportional to the amount of gas molecules n in the container of ideal gas. If you plot PV/T against n, you will obtain R - the ideal gas constant - from the gradient of the straight line through the origin.

## The Boltzmann Constant

The Boltzmann constant k is a constant used when relating the temperature of a gas to the mean translational kinetic energy of particles in the gas.

[![image.png](https://bookstack.asadhussain.net/uploads/images/gallery/2026-05/scaled-1680-/612image.png)](https://bookstack.asadhussain.net/uploads/images/gallery/2026-05/612image.png)

You use PV = nRT when you're dealing with amount of substance, and you use PV = NkT when dealing with numbers of molecules.

# Module 6

# 6.1 - Capacitors

## Core Info and Definitions

A capacitor is a circuit component that stores charge in a circuit by separating equal and opposite charges onto two electrical conductors (plates) with an insulator in between them.

Capacitance, C, defines the quantity of charge Q which can be stored per unit potential difference across the plates. Measured in farads

## Capacitance

[![image.png](https://bookstack.asadhussain.net/uploads/images/gallery/2026-01/scaled-1680-/f5Iimage.png)](https://bookstack.asadhussain.net/uploads/images/gallery/2026-01/f5Iimage.png)

... where epsilon 0 is the permittivity of free space, epsilon r is relative permittivity of the material, A is the surface area of a plate, and d is the separation between the plates.

### Capacitance of an Isolated Conducting Sphere:

[![image.png](https://bookstack.asadhussain.net/uploads/images/gallery/2026-01/scaled-1680-/XDKimage.png)](https://bookstack.asadhussain.net/uploads/images/gallery/2026-01/XDKimage.png)

... where R is the radius of the sphere.

### Total Circuit Capacitance

In series, capacitance sum is determined in a similar way to how resistance is determined with resistors in parallel:

[![image.png](https://bookstack.asadhussain.net/uploads/images/gallery/2026-01/scaled-1680-/lswimage.png)](https://bookstack.asadhussain.net/uploads/images/gallery/2026-01/lswimage.png)

In parallel, it's the opposite - the capacitances are just added to each other:

[![image.png](https://bookstack.asadhussain.net/uploads/images/gallery/2026-01/scaled-1680-/6myimage.png)](https://bookstack.asadhussain.net/uploads/images/gallery/2026-01/6myimage.png)

## Capacitor Energy

Capacitor energy can be given as:

[![image.png](https://bookstack.asadhussain.net/uploads/images/gallery/2026-01/scaled-1680-/TEIimage.png)](https://bookstack.asadhussain.net/uploads/images/gallery/2026-01/TEIimage.png)

... and you can use Q=CV to substitute values in to determine energy with charge.

(You do not need to know the integral derivation. It is only for explanation.)

The work done in moving a charge Q from one plate to another through a **constant potential difference** V is:

[![image.png](https://bookstack.asadhussain.net/uploads/images/gallery/2026-01/scaled-1680-/U7aimage.png)](https://bookstack.asadhussain.net/uploads/images/gallery/2026-01/U7aimage.png)

The reason the two energy equations are different is because **V is constant in the latter**, but **not the former**. Capacitance is a constant for each capacitor, however.

A capacitor can leak charge . This is because the insulator between the plates is not perfect, so there is a tiny current that passes through them. This charge leakage is more clearly observable when disconnecting a capacitor from the source of emf.

## Charging and Discharging

Where x<sub>0</sub> is the initial value of the variable, C is capacitance, R is resistance and t is elapsed time:

<table border="1" id="bkmrk-current-charge-pd-ch" style="border-collapse: collapse; width: 100%;"><colgroup><col style="width: 16.6865%;"></col><col style="width: 25.8641%;"></col><col style="width: 30.2741%;"></col><col style="width: 27.2944%;"></col></colgroup><tbody><tr><td>  
</td><td>**Current**  
</td><td>**Charge**  
</td><td>**PD**  
</td></tr><tr><td>**Charging**  
</td><td>[![image.png](https://bookstack.asadhussain.net/uploads/images/gallery/2026-01/scaled-1680-/3CFimage.png)](https://bookstack.asadhussain.net/uploads/images/gallery/2026-01/3CFimage.png)</td><td>[![image.png](https://bookstack.asadhussain.net/uploads/images/gallery/2026-01/scaled-1680-/1nJimage.png)](https://bookstack.asadhussain.net/uploads/images/gallery/2026-01/1nJimage.png)

</td><td>[![image.png](https://bookstack.asadhussain.net/uploads/images/gallery/2026-01/scaled-1680-/126image.png)](https://bookstack.asadhussain.net/uploads/images/gallery/2026-01/126image.png)

</td></tr><tr><td>**Discharging**  
</td><td>[![image.png](https://bookstack.asadhussain.net/uploads/images/gallery/2026-01/scaled-1680-/3CFimage.png)](https://bookstack.asadhussain.net/uploads/images/gallery/2026-01/3CFimage.png)

</td><td>[![image.png](https://bookstack.asadhussain.net/uploads/images/gallery/2026-01/scaled-1680-/9jHimage.png)](https://bookstack.asadhussain.net/uploads/images/gallery/2026-01/9jHimage.png)

</td><td>[![image.png](https://bookstack.asadhussain.net/uploads/images/gallery/2026-01/scaled-1680-/gmqimage.png)](https://bookstack.asadhussain.net/uploads/images/gallery/2026-01/gmqimage.png)

</td></tr></tbody></table>

(... yes, current has the same equation for charging and discharging.)

The time taken for the charge of the capacitor to fall to 1/e (~37%) of its original charge is known as the time constant.

[![image.png](https://bookstack.asadhussain.net/uploads/images/gallery/2026-01/scaled-1680-/KcKimage.png)](https://bookstack.asadhussain.net/uploads/images/gallery/2026-01/KcKimage.png)

As more charge is added to a capacitor, it gets harder to add more charge to it. This concept is analogous to pumping a car tyre - it is initially easy to add air to it, but the increase of internal pressure makes adding more harder and harder.

### Graphical Methods

Take V in discharging for an example. You can apply the natural logarithm "ln" to both sides to separate variables and obtain a straight line in a graph:

[![image.png](https://bookstack.asadhussain.net/uploads/images/gallery/2026-01/scaled-1680-/h6timage.png)](https://bookstack.asadhussain.net/uploads/images/gallery/2026-01/h6timage.png)

In here, the y-intercept is "ln(V<sub>0</sub>)" and the gradient is "-1/CR". You can use the gradient to find the capacitance of the circuit, and you can use the y-intercept to find the initial pd of the capacitor by raising e to the power of "ln(V<sub>0</sub>)".

### Spreadsheet Modelling

You can model the discharge of a capacitor using a spreadsheet method without using experimental data. This is known as iterative modelling. You can do this with the following equation:

[![image.png](https://bookstack.asadhussain.net/uploads/images/gallery/2026-01/scaled-1680-/kpGimage.png)](https://bookstack.asadhussain.net/uploads/images/gallery/2026-01/kpGimage.png)

This gives the decrease of charge, so the output of this should be subtracted from the last value of charge. The table looks like this[<sup>1</sup>](https://www.ocr.org.uk/Images/170416-modelling-decay-of-charge-activity-teacher-instructions.pdf):

[![image.png](https://bookstack.asadhussain.net/uploads/images/gallery/2026-01/scaled-1680-/akdimage.png)](https://bookstack.asadhussain.net/uploads/images/gallery/2026-01/akdimage.png)

... with a time increment of +0.1.

# 6.2 - Electric Fields

## Definitions and Core Info

An electric field is a region around a body in which other charged bodies will feel a force. The direction of the field is the direction of the force experienced by a positive test charge.

[![image.png](https://bookstack.asadhussain.net/uploads/images/gallery/2026-01/scaled-1680-/sPyimage.png)](https://bookstack.asadhussain.net/uploads/images/gallery/2026-01/sPyimage.png)

... where F is the size of the electrical force, Q is the size of the charge, epsilon 0 is the permittivity of free space, and r is the distance between the charged point and any point in the field.

## Electric Field Lines

Radial field vs uniform field<sup>[1](https://www.schoolphysics.co.uk/age16-19/Electricity%20and%20magnetism/Electrostatics/text/Electric_fields/index.html)</sup>:

[![image.png](https://bookstack.asadhussain.net/uploads/images/gallery/2026-01/scaled-1680-/fVfimage.png)](https://bookstack.asadhussain.net/uploads/images/gallery/2026-01/fVfimage.png)

The spacing between field lines represents the strength of the field.

The field between different types of charged surface<sup>[1](https://www.schoolphysics.co.uk/age16-19/Electricity%20and%20magnetism/Electrostatics/text/Electric_fields/index.html)</sup>:

[![image.png](https://bookstack.asadhussain.net/uploads/images/gallery/2026-01/scaled-1680-/1xLimage.png)](https://bookstack.asadhussain.net/uploads/images/gallery/2026-01/1xLimage.png)

The neutral point is between two like-charged particles, showing where no electric force is experienced.

## Coulomb's Law

[![image.png](https://bookstack.asadhussain.net/uploads/images/gallery/2026-01/scaled-1680-/wl9image.png)](https://bookstack.asadhussain.net/uploads/images/gallery/2026-01/wl9image.png)

... where Q and q are the charges of two charged points, epsilon 0 is the permittivity of free space, and r is the shortest distance between these charged points.

# 6.3 - Electromagnetism

## Definitions and Core Info

A magnetic field is a field in which a charged particle experiences a force. Its direction is determined by the force experienced by a positive test charge.

## Field Lines

[![image.png](https://bookstack.asadhussain.net/uploads/images/gallery/2026-02/scaled-1680-/VBmimage.png)](https://totalelement.com/blogs/about-neodymium-magnets/understanding-neodymium-magnetic-field-lines?srsltid=AfmBOoqRNYEPMPm89Yp09LiB0AGFGFnW5P8nx0JdewLxAVibYMp3vSPv)

## Magnetic Force

Flemings' left hand rule:

- **Th**umb: Thrust (force)
- Index/**F**irst finger: Magnetic field
- Middle/Se**c**ond: Current

[![image.png](https://bookstack.asadhussain.net/uploads/images/gallery/2026-02/scaled-1680-/tVGimage.png)](https://en.wikipedia.org/wiki/Fleming%27s_left-hand_rule_for_motors)

This rule is executed on the right hand (Flemings' right hand rule) if the wire is moving through a uniform magnetic field to determine the force on the wire. Not really necessary once you understand Lenz's law.

Right hand grip rule:

- Thumb: Direction of magnetic field.
- Grip: Direction of current in the coil.

[![image.png](https://bookstack.asadhussain.net/uploads/images/gallery/2026-02/scaled-1680-/Mq2image.png)](https://electrical4dummies.blogspot.com/2016/06/flemings-right-hand-rule-and-right-hand.html)

The "thrust" represents the magnetic force on a <span style="text-decoration: underline;">current-carrying wire/**moving** charge:</span>

![image.png](https://bookstack.asadhussain.net/uploads/images/gallery/2026-02/scaled-1680-/9Poimage.png) / ![image.png](https://bookstack.asadhussain.net/uploads/images/gallery/2026-02/scaled-1680-/5dUimage.png)

... where theta is the angle between the wire and the field lines.

In a magetic field, a moving charge moves in circular motion. The radius is derived as:

[![image.png](https://bookstack.asadhussain.net/uploads/images/gallery/2026-02/scaled-1680-/J3Yimage.png)](https://bookstack.asadhussain.net/uploads/images/gallery/2026-02/J3Yimage.png)

... where m is the mass of the particle, v is its velocity, B is the magnetic flux density it is going through, and q is its charge.

This can be used to perform selection of certain particles by their velocity.

1. Particles are charged such that they all have the same charge.
2. They are accelerated through an electric field on top of a magnetic field through a vacuum.
3. F = BQv, F = Eq, =&gt; E = Bv
4. Particles with the incorrect velocity will have unbalanced forces, causing them to undergo circular motion upwards or downwards as they pass through the vacuum.
5. Particles with the correct velocity will pass through the window.

[![image.png](https://bookstack.asadhussain.net/uploads/images/gallery/2026-02/scaled-1680-/iXzimage.png)](https://bookstack.asadhussain.net/uploads/images/gallery/2026-02/iXzimage.png)

In a mass spectrometer, charged particles with the selected velocity will pass through the window and undergo circular motion, circling upwards with varying radii depending on mass. Different numbers of these charged particles will interact with different parts of the detector, and their abundances are proportional to generated current due to electron flow.

## Electromagnetic Induction

### Magnetic Flux

[![image.png](https://bookstack.asadhussain.net/uploads/images/gallery/2026-02/scaled-1680-/q9Timage.png)](https://bookstack.asadhussain.net/uploads/images/gallery/2026-02/q9Timage.png)

... where B is the magnetic flux density, A is the cross sectional area of the coil, and theta is the angle of the coil from the vertical of the cross section.

Flux linkage:

[![image.png](https://bookstack.asadhussain.net/uploads/images/gallery/2026-02/scaled-1680-/abHimage.png)](https://bookstack.asadhussain.net/uploads/images/gallery/2026-02/abHimage.png)

... where N is the number of turns in the coil.

### Faraday's Law

The EMF induced in a coil is equal to the rate of change of magnetic flux linkage.

[![image.png](https://bookstack.asadhussain.net/uploads/images/gallery/2026-02/scaled-1680-/B05image.png)](https://bookstack.asadhussain.net/uploads/images/gallery/2026-02/B05image.png)

### Lenz's Law

If the magnetic flux linkage through a coil changes, an emf is induced that drives a current whose magnetic field opposes the change in flux. This opposition is a consequence of conservation of energy.

### AC Generators

A coil of wire rotates inside a uniform magnetic field. Magnetic flux increases as it reaches 180 degrees, and decreases as it continues turning to 360 degrees. This alternating rate of change of magnetic flux linkage causes an alternating emf to be induced in the coil as per Faraday's law, causing an alternating current to be generated. As the coil rotates, slip rings also rotate with it, which interact with brushes (made from carbon and copper) to allow electrical contact from the slip rings to an external circuit. Contains:

- A permanent magnet
- A rectangular coil
- Slip rings
- Brushes

[![image.png](https://bookstack.asadhussain.net/uploads/images/gallery/2026-02/scaled-1680-/LoAimage.png)](https://www.scienceflip.com.au/subjects/physics/electromagnetism/learn10/)

### Transformers

[![image.png](https://bookstack.asadhussain.net/uploads/images/gallery/2026-02/scaled-1680-/jWMimage.png)](https://bookstack.asadhussain.net/uploads/images/gallery/2026-02/jWMimage.png)

An alternating current is passed through the primary coil, causing an alternating magnetic field to be generated, along with alternating magnetic flux lines through the soft iron core, which maximises retainment of magnetic flux lines due to magnetic shielding. This generates an alternating EMF in the secondary coil due to Faraday's law.

[![image.png](https://bookstack.asadhussain.net/uploads/images/gallery/2026-02/scaled-1680-/7Tbimage.png)](https://bookstack.asadhussain.net/uploads/images/gallery/2026-02/7Tbimage.png)

... where V<sub>s</sub> and N<sub>s</sub> are the EMF and number of turns in the secondary coil, and p is likewise for the primary coil.

Transformers can be &gt;95% efficient, with some reaching over 99% efficiency.

An Eddy current can be created in the soft iron core due to the magnetic field from the primary coil. This creates an opposing magnetic field and releases energy into the core as heat, reducing efficiency. This is mitigated by laminating the transformer cores - i.e. making them made up of layers of iron stuck together instead of being one solid block of iron.

# 6.4 - Nuclear and Particle Physics

## The Nuclear Atom

The alpha particle scattering experiment involved the firing of alpha particles at a thin sheet of gold foil. Due to the old belief in the plum-pudding model for the atom, it was expected that the alpha particles would pass straight through the sheet due to their momentum.

Actual observations:

- Most passed through.
- Some were deflected at an angle.
- Some reflected completely back towards the detector's direction.

Deductions:

- The atom is mostly empty space.
- The vast majority of the atom's mass is concentrated at the centre of the atom (the nucleus).
- There is a very small, concentrated point of positive charge at the centre of the atom (the nucleus).

Bohr's "nuclear model" of the atom involves electrons orbiting certain orbits/energy levels around a central nucleus (that contains the vast majority of the mass).

Isotopes are atoms of an element with the same number of protons but a different number of neutrons. The term **nuclide** refers to a specific species of atom. E.g. C-12 and C-14 are different isotopes of carbon, but a C-12 nuclide has two less neutrons than a C-14 nuclide.

## The Strong Nuclear Force

Using Coulomb's law, we can calculate the electric force between two protons at 3fm of separation:

[![image.png](https://bookstack.asadhussain.net/uploads/images/gallery/2026-03/scaled-1680-/image.png)](https://bookstack.asadhussain.net/uploads/images/gallery/2026-03/image.png)

This is an extremely large force for protons this close to each other. The gravitational force is far too small considering how low the mass of a proton is. The actual force counteracting this electric force is known as the strong nuclear force.

This force acts within the confines of the nucleus, but decreases rapidly with distance and does not extend much beyond adjacent protons and neutrons. The force must act between nucleons, and is independent of charge. At a particular distance, however, it turns from an attractive force to a repulsive force, otherwise the nucleus would collapse on itself:

[![image.png](https://bookstack.asadhussain.net/uploads/images/gallery/2026-03/scaled-1680-/IdWimage.png)](https://animalia-life.club/qa/pictures/strong-nuclear-force)

The strong nuclear force, as you can see, stops acting just a little before 4fm of nucleon separation.

## Nuclear Density

As the number of nucleons increases, the radius of an atom increases at a decreasing rate, reaching a constant-looking positive gradient on a radius x nucleon graph. The radius of a nucleus can be determined using:

[![image.png](https://bookstack.asadhussain.net/uploads/images/gallery/2026-03/scaled-1680-/l5Rimage.png)](https://bookstack.asadhussain.net/uploads/images/gallery/2026-03/l5Rimage.png)

... where r0 is a constant and A is the nucleon number of the atom. r0 is approximately 1.05fm = 1.05e-15m.

Nuclear density is equal to:

[![image.png](https://bookstack.asadhussain.net/uploads/images/gallery/2026-03/scaled-1680-/MwTimage.png)](https://bookstack.asadhussain.net/uploads/images/gallery/2026-03/MwTimage.png)

... where mn is the mass of a nucleon. Since all of these values are constants, **all nuclei have the same density**.

## Fundamental Particles

- Hadrons are particles consisting of a combination of quarks to give a net zero or whole number charge, and can be subject to the strong nuclear force. E.g. neutrons and protons.
- Leptons are a type of fundamental particle. E.g. electrons and neutrinos. Each charged lepton has its own neutrino version, e.g. an electron neutrino or a muon neutrino.
- Quarks are fundamental particles that are components of hadrons. E.g. up and down quarks.
- The weak nuclear force is experienced by both quarks and leptons, and is responsible for beta decay due to the ability to change quarks' types and leptons' types.
- An antiparticle is a particle of antimatter that has the same rest mass as the original with an equal and opposite charge. When they collide with their original, they annihilate, turning into energy as per E = mc<sup>2</sup> as two gamma photons in opposite directions.

The three quarks that were initially proposed were called the "up", "down", and "strange" quarks:

<table border="1" id="bkmrk-quarks-antiquarks-ty" style="border-collapse: collapse; width: 100%;"><colgroup><col style="width: 33.3704%;"></col><col style="width: 10.0111%;"></col><col style="width: 8.22342%;"></col><col style="width: 8.81932%;"></col><col style="width: 13.1098%;"></col><col style="width: 12.2822%;"></col><col style="width: 14.295%;"></col></colgroup><tbody><tr><td>  
</td><td>**Quarks**</td><td>  
</td><td>  
</td><td>**Antiquarks**</td><td>  
</td><td>  
</td></tr><tr><td>**Type**</td><td>up</td><td>down</td><td>strange</td><td>anti-up</td><td>anti-down</td><td>anti-strange</td></tr><tr><td>**Symbol**</td><td>u</td><td>d</td><td>s</td><td>u bar</td><td>d bar</td><td>s bar</td></tr><tr><td>**Charge Q**</td><td>+2e/3</td><td>-1e/3</td><td>-1e/3</td><td>-2e/3</td><td>+1e/3</td><td>+1e/3</td></tr><tr><td>**Strangeness S**</td><td>0</td><td>0</td><td>-1</td><td>0</td><td>0</td><td>+1</td></tr><tr><td>**Baryon number B**</td><td>1/3</td><td>1/3</td><td>1/3</td><td>-1/3</td><td>-1/3</td><td>-1/3</td></tr></tbody></table>

We can use these quarks to see how certain particles and antiparticles are constructed:

<table border="1" id="bkmrk-particle-antiparticl" style="border-collapse: collapse; width: 100%;"><colgroup><col style="width: 50.0596%;"></col><col style="width: 50.0596%;"></col></colgroup><tbody><tr><td>**Particle**</td><td>**Antiparticle**</td></tr><tr><td>Proton: uud</td><td>Anti-Proton: u-bar d-bar d-bar</td></tr><tr><td>Neutron: udd</td><td>Anti-Neutron: u-bar u-bar d-bar</td></tr></tbody></table>

When a proton decays to a neutron, it just means an up quark of a proton decays to a down quark. Since the difference in charge of an up and down quark is -1e, an electron is released - beta minus decay.

## Radioactivity

Radioactive decay is the spontaneous and random decay of an unstable nucleus by the emission of alpha, beta, and gamma radiation. The word "spontaneous" is used because decay is not affected by any external factors, such as temperature, pressure, chemical reactions, and magnetic fields. Neither the exact number of decays per second nor the fact that a particle will decay can be estimated.

<table border="1" id="bkmrk-type-description-alp" style="border-collapse: collapse; width: 100%;"><colgroup><col style="width: 15.5358%;"></col><col style="width: 84.5834%;"></col></colgroup><tbody><tr><td>**Type**</td><td>**Description**</td></tr><tr><td>Alpha</td><td>- Release of a helium nucleus.
- Low penetrating power.
- Most ionising.

Alpha decay example:

[![image.png](https://bookstack.asadhussain.net/uploads/images/gallery/2026-03/scaled-1680-/Lzoimage.png)](https://bookstack.asadhussain.net/uploads/images/gallery/2026-03/Lzoimage.png)

</td></tr><tr><td>Beta</td><td>- Release of an electron+antineutrino or positron+neutrino.
- High penetrating power.
- Less ionising, but still dangerous.
- 99% the speed of light.

Beta minus decay example and quark equation (electron antineutrino, missing subscript e):

[![image.png](https://bookstack.asadhussain.net/uploads/images/gallery/2026-03/scaled-1680-/IUoimage.png)](https://bookstack.asadhussain.net/uploads/images/gallery/2026-03/IUoimage.png)

[![image.png](https://bookstack.asadhussain.net/uploads/images/gallery/2026-03/scaled-1680-/KNhimage.png)](https://bookstack.asadhussain.net/uploads/images/gallery/2026-03/KNhimage.png)

Beta plus decay example and quark equation (electron neutrino, missing subscript e):

[![image.png](https://bookstack.asadhussain.net/uploads/images/gallery/2026-03/scaled-1680-/cHdimage.png)](https://bookstack.asadhussain.net/uploads/images/gallery/2026-03/cHdimage.png)

[![image.png](https://bookstack.asadhussain.net/uploads/images/gallery/2026-03/scaled-1680-/EQmimage.png)](https://bookstack.asadhussain.net/uploads/images/gallery/2026-03/EQmimage.png)

</td></tr><tr><td>Gamma</td><td>- Release of gamma photons.
- Highest penetrating power.
- Least ionising.
- Usually accompanies either alpha or beta decay when a daughter nuclide is left in an excited state, but never occurs as a purely gamma decay.

</td></tr></tbody></table>

## Radioactive Decay Equations and Half Life

The activity dictates the number of nuclear decays per unit time. One decay per second is known as 1Bq (becquerel).

The decay constant lambda is the probability that an individual nucleus will decay per unit time.

[![image.png](https://bookstack.asadhussain.net/uploads/images/gallery/2026-03/scaled-1680-/duAimage.png)](https://bookstack.asadhussain.net/uploads/images/gallery/2026-03/duAimage.png)

... where A is activity and N is the number of undecayed nuclei. The rate of change of undecayed nuclei is:

[![image.png](https://bookstack.asadhussain.net/uploads/images/gallery/2026-03/scaled-1680-/IlOimage.png)](https://bookstack.asadhussain.net/uploads/images/gallery/2026-03/IlOimage.png)

General decay equations for exponential decrease from initial values A0 and N0 are:

[![image.png](https://bookstack.asadhussain.net/uploads/images/gallery/2026-03/scaled-1680-/pj3image.png)](https://bookstack.asadhussain.net/uploads/images/gallery/2026-03/pj3image.png)

You can rearrange these using ln and log laws in order to find lambda using graphical methods.

A substance's half life is the amount of time taken for the activity of a substance or the number of undecayed nuclei to halve. Can be estimated with a Nxt graph. You can substitute A = 0.5A<sub>0</sub> into the above exponential equation to find the half life given the value of lambda.

## Radioactive Dating

### Carbon Dating

Organisms take in carbon dioxide from the atmosphere. A small fraction of carbon atoms in this CO2 is the radioactive C-14 isotope of carbon rather than the normal C-12 isotope. Once an organism dies, it no longer takes in CO2, so the C-14 starts to decay into nitrogen.

The ratio of C-14 to C-12 decreases over time, and can be compared with the ration of a currently living organism to estimate the age of the organism/object.

However, since the amount of C-14 is so small, count rates are also very small, and after a few half lives may be indistinguishable from the background count rate. It also assumes the ratio of C-14 to C-12 in the atmosphere has always been constant, which may not be true.

### Dating Rocks

All rocks contain tiny amounts of radioactive isotopes such as U-238 and Ru-87, which have very long half lives. Relative proportions of the parent atoms and decay products can be used to estimate age.

## Generating Energy

### Nuclear Fission

Nuclear fission is when a radioactive nucleus absorbs a high-energy neutron, causing it to split into two more-stable nuclei and release 2-3 high-energy neutrons and gamma radiation. (Extra: Energy also comes from KE of daughter nuclei, which collide with moderator particles to transfer energy.)

e.g. uranium 235 (insert example here)

A nuclear fission reactor consists of a solid concrete wall, a moderator, and a reaction chamber in the moderator. Inside the reaction chamber, there are numerous control rods and pills containing the radioactive substance.

(diagram here)

- The concrete wall ensures that radiation cannot escape the reaction chamber, keeping employees safe from radiation exposure.
- The moderator reduces the speed of high-energy neutrons so that they can be absorbed by nuclei. (There was another advantage)
- The control rods are made of a material such as boron, and exist to absorb excess high-energy neutrons. This is to keep control of the chain reaction. Losing control leads to reactor meltdowns such as Chernobyl.

### Nuclear Fusion

Nuclear fusion is when two nuclei are fused together, releasing energy based on the difference in binding energy of the product and the total binding energy of the constituent nuclei.

Binding energy is the minimum energy required to separate the nucleons to infinity.

[![image.png](https://bookstack.asadhussain.net/uploads/images/gallery/2026-03/scaled-1680-/J39image.png)](https://www.slideserve.com/torgny/life)

e.g. there is an increase from H-1 to H-2, meaning it releases ~1,7MeV of energy on fusion.

# 6.5 - Medical Imaging

## Xray production

Electrons are emitted into a vacuum tube via thermionic emission. An external power supply produces a massive p.d. between the anode and cathode, causing the electrons to be rapidly accelerated in this high-voltage electric field. Then they are rapidly decelerated with collisions with a hard metal anode, causing them to lose KE (~1%) which is emitted as xrays. Rest is lost to the anode as thermal energy. Their KE is transformed into high-frequency photons of EM radiation. This radiation is called Bremsstrahlung radiation. The below graph shows an example of x-ray energy distribution.

[![image.png](https://bookstack.asadhussain.net/uploads/images/gallery/2026-04/scaled-1680-/image.png)](https://bookstack.asadhussain.net/uploads/images/gallery/2026-04/image.png)

The spikes, known as Characteristic X-rays, occur when a high-speed projectile electron knocks an inner-shell electron out of a target atom, creating a vacancy. To stabilize the atom, an electron from a higher-energy outer shell drops down to fill this hole, releasing a photon with an energy exactly equal to the difference between those two specific shells. Because these atomic energy levels are unique and discrete for every element, the resulting X-rays appear as sharp, high-intensity peaks at specific energy values rather than a continuous spread. This makes the spikes a "spectral fingerprint" of the specific metal used in the xray tube's anode.

## Xray focusing

Straight, parallel xrays are created by directing xrays to a thin window which enters a collimator that absorbs xrays that are not parallel to it. Xray energy is absorbed by tissue as it passes through the body, and how effective this absorption is depends on the attenuation coefficient mu, which is constant for different materials. The energy before entering and after exiting the body can be measured. These differences can be visualised on photographic film or a digital image to view the targeted body part.

## Xray attenuation

"Exponential decay"-like formula for xray intensity loss:

[![image.png](https://bookstack.asadhussain.net/uploads/images/gallery/2026-01/scaled-1680-/image.png)](https://bookstack.asadhussain.net/uploads/images/gallery/2026-01/image.png)

- I = Intensity
- I0 = Initial intensity
- Mu = Attenuation coefficient
- x = Distance traveled through body

Mu α z^3  
... where z is the proton number of the material.

### Attenuation mechanisms

[![image.png](https://bookstack.asadhussain.net/uploads/images/gallery/2026-01/scaled-1680-/8peimage.png)](https://bookstack.asadhussain.net/uploads/images/gallery/2026-01/8peimage.png)

#### Simple Scattering (a)

Simple scattering is when xray photons reflect off of bone if they do not have sufficient energy to do more complex scattering.

#### Photoelectric Effect (b)

Via the photoelectric effect, xray photons are absorbed by electrons into the material, releasing photoelectrons.

#### Compton effect (c)

In the Compton effect, a photon interacts inelastically with an electron. The photon transfers some of its energy and momentum to the electron. The photon is scattered with **less energy**, while the electron is removed from the atom. Both energy and momentum are conserved in this interaction.

#### Pair Production (d)

Pair production is when an electron-positron pair is spontaneously created as the xray passes through the electric field of an atom. The required energy is about 1.02MeV, as derived below:

[![image.png](https://bookstack.asadhussain.net/uploads/images/gallery/2026-01/scaled-1680-/5fDimage.png)](https://bookstack.asadhussain.net/uploads/images/gallery/2026-01/5fDimage.png)

Not very applicable in medical imaging, as xrays usually don't have this much energy.

## Medical Tracers

<span style="font-family: 'Segoe UI';">Medical tracers are substances injected into a body. Their position in the body can be detected.</span>

- Fluorine-18 for beta+ decay. Protons decay into neutrons, releasing a positron and an electron-neutrino. The positron annihilates with an electron, releasing two gamma photons travelling in exactly opposite directions which are detected.
- Technetium-99m decays to immediately release gamma photons. Primarily used to monitor major organs. The "m" means metastable, meaning it remains in a high energy state for prolonged periods of time, eventually decaying to a far more stable isotope of technetium.

### Gamma detection

[![image.png](https://bookstack.asadhussain.net/uploads/images/gallery/2026-01/scaled-1680-/0viimage.png)](https://bookstack.asadhussain.net/uploads/images/gallery/2026-01/0viimage.png)![image.png](https://bookstack.asadhussain.net/uploads/images/gallery/2026-01/scaled-1680-/9YFimage.png)

1. Gamma photons pass through the collimator if their direction of travel is parallel to it. Otherwise, they are absorbed by it.
2. These high-energy photons interact with the scintillator, releasing multiple more lower energy photons (usually visible light).
3. The <span style="text-decoration: underline;">light guide/photocathode</span> absorbs the photons and releases photoelectrons via the photoelectric effect.
4. These electrons travel through the photomultiplier tube, generating more electrons to be passed into a computer for imaging.

In the photomultiplier tube, a photoelectron hits the first plate, releasing more electrons that hit the next plate, which causes more electrons to be released to hit the next plate. This repeats, generating lots of electrons that can create a substantial current.

## CAT Scans

Uses xrays to create a 3-dimensional image of a person's body.

The machine is a ring that the person's body passes through. It generates a fan shaped beam of xrays to take 2d slices of the person's body, which are picked up by a ring of elecronic detectors. The images are stacked on top of each other in a computer program to create the 3D product.

The resolution of the image is greater and can distinguish between different soft tissues, which 2D xrays cannot do.

However, it takes significantly longer than a 2D xray, so the patient is exposed to a higher dose of ionising radiation. About 10-30 minutes.

## PET Scans

PET scans detect gamma rays generated from annihilation between positrons and electrons to create a 2D or 3D image. It has a ring of gamma detectors/cameras that pass up and down the patient to generate a 3D image.

Positron-electron annihilation releases two photons in opposite directions. The ring can pick up both of these and use the time delay between their arrivals to calculate the exact location of the annihilation event, characterising the depth inside the body. This means PET scans have a higher resolution than other gamma cameras.

## Ultrasound

A high frequency longitudinal wave of &gt;20kHz.

<sub>(A piezoelectric material generates a voltage when it is contracted or expanded, or **will contract and expand when a voltage is applied.**) </sub>Applying an alternating voltage to a piezoelectric crystal causes it to contract and expand at the same frequency as the alternating source, producing ultrasound waves.

An ultrasound transducer has an alternating potential difference causing repetitive compression and stretching of the crystal. The crystal's resonant frequency is chosen to increase intensity. After creation of the ultrasound, the potential difference is removed and the reflected signal is read.

- An A type ultrasound scan produces a very low resolution 1D image. It is used to determine distances from the ultrasound device to the point of reflection. This is achieved by measuring time delay between generating and receiving the signal, using the speed of sound to approximate distance.
- A B type ultrasound scan produces a 2D image by moving the transducer over the patient's skin. It is effectively a series of A type scans stitched together to form an image.

[![image.png](https://bookstack.asadhussain.net/uploads/images/gallery/2026-02/scaled-1680-/2ZUimage.png)](https://bookstack.asadhussain.net/uploads/images/gallery/2026-02/2ZUimage.png)

... where Z is acoustic impedance, rho is the density, and c is the speed of sound in the material.

[![image.png](https://bookstack.asadhussain.net/uploads/images/gallery/2026-02/scaled-1680-/rM6image.png)](https://bookstack.asadhussain.net/uploads/images/gallery/2026-02/rM6image.png)

I<sub>r</sub> is the intensity of reflected ultrasound. I<sub>0</sub> is the intensity of incoming ultrasound. The ratio is known as the reflection coefficient.

A gel is put on the skin before an ultrasound. It has a similar acoustic impedance to skin to minimise the amount of reflected ultrasound waves.

### The Doppler Effect

The Doppler effect is the observed change in the frequency of a wave when it is reflected off of or produced by a moving source, e.g. an ambulance siren.

[![image.png](https://bookstack.asadhussain.net/uploads/images/gallery/2026-02/scaled-1680-/PoGimage.png)](https://bookstack.asadhussain.net/uploads/images/gallery/2026-02/PoGimage.png)

... where delta f is the observed shift in frequency, f is the original frequency, v is the speed of blood flow, theta is the angle between the probe and blood flow direction, and c is the speed of ultrasound in blood.

# A Level Core Practicals

# A-Level Physics Practicals

This document covers the core practical procedures across the A-Level Physics course, organized by module

---

## Module 3: Mechanics

### 1. Investigating Motion and Collisions

Focuses on verifying momentum conservation or investigating the relationship between force and acceleration.

**Equipment**

- Trolleys or air track gliders
- Air track or friction-compensated ramp
- Light gates and a digital data logger
- Interrupter cards (of known length)
- Masses and string (if investigating $F=ma$)

**Method &amp; Data Analysis**

1. Set up the air track or ramp. If using a ramp, tilt it slightly to compensate for friction.
2. Attach an interrupter card to the trolley and set up two light gates.
3. For a collision, place one trolley at rest and launch the second toward it.
4. Record initial velocity ($u$) and final velocities ($v$) using light gates.
5. Measure the mass of each trolley.
6. **Data Analysis:** Compare initial momentum ($m\_1u\_1 + m\_2u\_2$) to final momentum ($m\_1v\_1 + m\_2v\_2$).
7. **Data Analysis:** Calculate kinetic energy ($1/2mv^2$) to determine if the collision was elastic.

**Improving Accuracy**

- Use an air track to eliminate friction.
- Ensure interrupter cards are vertical and measured precisely.
- Repeat measurements and calculate a mean.

**Safety**

- Use a "catch box" to stop trolleys falling.
- Securely attach masses to the string.

---

### 2. Determining Acceleration of Free Fall ($g$)

Measuring $g$ using a falling object and electronic timing.

**Equipment**

- Electromagnet and steel ball bearing
- Trapdoor and base unit
- Electronic timer or data logger
- Metre ruler and plumb line

**Method &amp; Data Analysis**

1. Position the electromagnet at height ($h$) above the trapdoor.
2. Release the ball; the timer starts on release and stops when the trapdoor is hit.
3. Repeat for at least five different heights.
4. **Data Analysis:** Use $h = 1/2gt^2$ (from $s = ut + 1/2at^2$ where $u=0$).
5. **Data Analysis:** Plot $h$ vs $t^2$. Gradient = $g/2$.

**Improving Accuracy**

- Use a small, dense ball to minimize air resistance.
- Measure height from the bottom of the ball to the top of the trapdoor.

**Safety**

- Switch off electromagnet when not in use.
- Keep floor clear of trip hazards.

---

### 3. Determining Terminal Velocity in Fluids

Investigating motion when drag force equals weight.

**Equipment**

- Large transparent cylinder
- Viscous liquid (Glycerol or heavy oil)
- Steel ball bearings (varying sizes)
- Stopwatch and rubber bands (for markers)

**Method &amp; Data Analysis**

1. Mark equal intervals on the cylinder using rubber bands.
2. Drop the ball bearing into the center.
3. Record time at each marker; constant time between markers indicates terminal velocity.
4. **Data Analysis:** Calculate $v = \\Delta s / \\Delta t$.
5. **Data Analysis:** Plot velocity vs time; the plateau is terminal velocity.

**Improving Accuracy**

- Drop in the center to avoid "wall effects."
- Use a tall enough cylinder to ensure terminal velocity is reached.
- Use video analysis for more precise timing.

**Safety**

- Clean spills immediately (slippery).
- Wear goggles to prevent splashes.

---

### 4. Experimental Determination of Centre of Gravity

Using the principle of moments to locate the balancing point.

**Equipment**

- Irregularly shaped flat object (lamina)
- Plumb line (string and weight)
- Clamp stand, pin, and pencil

**Method &amp; Data Analysis**

1. Make three holes near the edges of the lamina.
2. Suspend the lamina and plumb line from a pin through one hole.
3. Mark the path of the plumb line on the lamina.
4. Repeat for other holes.
5. **Data Analysis:** The intersection of the lines is the centre of gravity.

**Improving Accuracy**

- Ensure the lamina swings freely.
- Use a thin, sharp pencil for lines.
- Space holes widely around the perimeter.

**Safety**

- Take care with pins to avoid finger pricks.
- Secure the clamp stand to the desk.

---

### 5. Investigating Force-Extension Characteristics

Applying Hooke’s Law to determine material stiffness.

**Equipment**

- Helical spring, rubber band, or polythene strip
- Clamp stand and slotted masses
- Millimetre ruler and set square

**Method &amp; Data Analysis**

1. Measure original length ($l\_0$).
2. Add masses in increments, recording the new length ($l$).
3. Calculate extension $x = l - l\_0$.
4. Unload masses to check for plastic deformation.
5. **Data Analysis:** Plot Force vs Extension.
6. **Data Analysis:** Gradient of linear section is the spring constant ($k$) where $F = kx$.

**Improving Accuracy**

- Use a set square to avoid parallax error.
- Wait for oscillations to stop before reading.

**Safety**

- Wear goggles in case the spring snaps.
- Use a padded box under masses to protect feet.

---

## Module 4: Electrons, Waves, and Photons

### 6. Determining the Young Modulus

Determining stiffness by measuring the ratio of tensile stress to tensile strain.

**Equipment**

- Long, thin metal wire
- G-clamp, pulley, and slotted masses
- Micrometer and travelling microscope

**Method &amp; Data Analysis**

1. Measure wire diameter in several places to find average area ($A$).
2. Measure original length ($L$) from clamp to marker.
3. Add masses and measure extension ($\\Delta L$) using a travelling microscope.
4. **Data Analysis:** Calculate stress ($\\sigma = F/A$) and strain ($\\varepsilon = \\Delta L/L$).
5. **Data Analysis:** Plot Stress vs Strain. Gradient = Young Modulus ($E$).

**Improving Accuracy**

- Use a long wire (3m+) for larger extensions.
- Ensure the wire is straight and free of kinks.

**Safety**

- Wear goggles; wire can whip if it snaps.
- Use a padded box for falling weights.

---

### 7. Investigating Electrical Characteristics (I-V)

Examining how current varies with potential difference across components.

**Equipment**

- Variable DC power supply or rheostat
- Ammeter and Voltmeter
- Components: Resistor, filament lamp, diode, thermistor

**Method &amp; Data Analysis**

1. Connect component in series with ammeter and variable resistor.
2. Connect voltmeter in parallel across the component.
3. Vary potential difference and record $I$ and $V$.
4. Reverse connections for negative readings.
5. **Data Analysis:** Plot $I$ vs $V$.

**Improving Accuracy**

- Use a potential divider for better control at low voltages.
- Switch off between readings to prevent heating.

**Safety**

- Components can become hot; avoid touching during operation.

---

### 8. Determining the Resistivity of a Metal

Calculating material-specific property independent of dimensions.

**Equipment**

- Resistance wire and micrometer
- Ammeter, Voltmeter, and metre ruler
- Jockey or crocodile clips

**Method &amp; Data Analysis**

1. Measure wire diameter to find area ($A$).
2. Vary the length ($L$) of wire in the circuit.
3. Record Resistance ($R = V/I$) for each length.
4. **Data Analysis:** Plot $R$ vs $L$. Gradient = $\\rho/A$.
5. **Data Analysis:** $\\rho = \\text{gradient} \\times A$.

**Improving Accuracy**

- Pull wire taut against the ruler.
- Use low current to minimize heating.

**Safety**

- Wire can become very hot; do not touch while power is on.

---

### 9. Determining Internal Resistance

Investigating terminal voltage drop under load.

**Equipment**

- Cell, variable resistor, and switch
- Ammeter and Voltmeter

**Method &amp; Data Analysis**

1. Record e.m.f. ($\\varepsilon$) with switch open ($I=0$).
2. Close switch and vary current ($I$) using the variable resistor.
3. Record terminal voltage ($V$) and $I$.
4. **Data Analysis:** Use $V = \\varepsilon - Ir$.
5. **Data Analysis:** Plot $V$ vs $I$. y-intercept = $\\varepsilon$, magnitude of gradient = $r$.

**Improving Accuracy**

- Use a new battery for stable readings.
- Close switch only briefly for each reading.

**Safety**

- Avoid short circuits to prevent cell damage or leaks.

---

### 10. Investigating Potential Divider Circuits

Creating specific output voltages using resistor combinations.

**Equipment**

- Power supply, fixed resistors
- Thermistor or LDR
- Voltmeter, water bath/lamp

**Method &amp; Data Analysis**

1. Set up two components in series.
2. Measure $V\_{out}$ across one component.
3. Vary temperature (thermistor) or light (LDR).
4. **Data Analysis:** Compare to $V\_{out} = V\_{in} \\times (R\_2 / (R\_1 + R\_2))$.

**Improving Accuracy**

- Keep thermometer and thermistor close together.
- Measure distance to light source for LDR.

**Safety**

- Keep water away from power supplies.

---

### 11. Using an Oscilloscope to Determine Frequency

Measuring time periods to calculate wave frequency.

**Equipment**

- Oscilloscope (CRO)
- Signal generator

**Method &amp; Data Analysis**

1. Connect signal generator to CRO.
2. Adjust Time-base to see at least one full cycle.
3. Measure horizontal divisions for one cycle.
4. Calculate Period ($T$) = divisions $\\times$ Time-base.
5. **Data Analysis:** Frequency $f = 1/T$.

**Improving Accuracy**

- Measure across multiple cycles and divide.
- Align cycle start with a major grid line.

**Safety**

- Ensure equipment is PAT tested.

---

### 12. Demonstrating Wave Effects in a Ripple Tank

Visualizing reflection, refraction, and diffraction.

**Equipment**

- Ripple tank, motor-driven dipper
- Strobe light
- Barriers and glass blocks

**Method &amp; Data Analysis**

1. Set up shallow water and constant dipper frequency.
2. Use strobe to "freeze" waves.
3. Use barriers for reflection/diffraction and glass blocks for refraction.
4. **Data Analysis:** Measure $\\lambda$; calculate $v = f\\lambda$.

**Improving Accuracy**

- Use a strobe for stable measurements.
- Ensure tank is level and on a damped surface.

**Safety**

- Keep water away from electricity.
- Be aware of strobe sensitivity (epilepsy).

---

### 13. Observing Polarising Effects

Demonstrating transverse wave planes.

**Equipment**

- Microwave transmitter/receiver and metal grille
- Light source and polarising filters

**Method &amp; Data Analysis**

1. **Light:** Rotate one filter relative to another; observe intensity changes.
2. **Microwaves:** Rotate metal grille between transmitter and receiver.
3. **Data Analysis:** Note absorption when wires are parallel to electric field oscillation.

**Improving Accuracy**

- Use a digital light sensor.
- Keep metal objects away from microwave path.

**Safety**

- Do not look directly at high-intensity light.

---

### 14. Investigating Refraction and Total Internal Reflection

Mapping light paths across media boundaries.

**Equipment**

- Ray box, glass blocks (rectangular and semi-circular)
- Protractor and paper

**Method &amp; Data Analysis**

1. Trace block outline and entry/exit rays.
2. Measure angles of incidence ($i$) and refraction ($r$).
3. For TIR, use semi-circular block and increase $i$ until refraction disappears.
4. **Data Analysis:** Plot $\\sin i$ vs $\\sin r$. Gradient = $n$.
5. **Data Analysis:** Verify $n = 1 / \\sin C$.

**Improving Accuracy**

- Use a thin ray and sharp pencil.
- Use a large protractor.

**Safety**

- Ray boxes get hot; turn off when not in use.

---

### 15. Superposition Experiments

Investigating interference patterns from coherent sources.

**Equipment**

- Two speakers/Laser/Microwaves
- Double-slit slide and screen

**Method &amp; Data Analysis**

1. Shine laser through double-slit.
2. Measure slit separation ($d$), distance to screen ($D$), and fringe width ($w$).
3. **Data Analysis:** $\\lambda = \\frac{dw}{D}$.

**Improving Accuracy**

- Ensure $D$ is large ($2\\text{m}+$).
- Measure across several fringes and divide.

**Safety**

- **Laser Safety:** Never look directly into the beam.

---

### 16. Determining the Wavelength of Light

Using diffraction to measure nanometer-scale wavelengths.

**Equipment**

- Laser, diffraction grating
- Metre ruler and tape measure

**Method &amp; Data Analysis**

1. Shine laser through grating onto screen.
2. Measure distance to screen ($D$) and distance to maxima ($x$).
3. Calculate slit separation $d$ from lines per mm.
4. **Data Analysis:** Use $d \\sin \\theta = n\\lambda$ where $\\tan \\theta = x/D$.

**Improving Accuracy**

- Large $D$ reduces percentage uncertainty.
- Measure between orders (e.g., $+1$ to $-1$) and divide.

**Safety**

- Standard laser safety protocols.

---

### 17. Observing Stationary Waves

Demonstrating interference forming nodes and antinodes.

**Equipment**

- Vibration generator, signal generator
- String, pulley, and weights

**Method &amp; Data Analysis**

1. Vary frequency until a standing wave forms.
2. Find harmonics.
3. **Data Analysis:** Node-to-node distance = $\\lambda/2$.
4. **Data Analysis:** Calculate $v = f\\lambda$.

**Improving Accuracy**

- Use a sharp bridge for the fixed end.
- Repeat for multiple harmonics.

**Safety**

- Wear goggles in case the string snaps.

---

### 18. Determining the Speed of Sound in Air

Using resonance in a closed pipe.

**Equipment**

- Resonance tube, cylinder of water
- Tuning forks, metre ruler

**Method &amp; Data Analysis**

1. Hold vibrating fork over tube and raise from water until resonance.
2. Measure air column length ($L$).
3. **Data Analysis:** First resonance $L + c = v/4f$ ($c$ is end correction).
4. **Data Analysis:** Plot $L$ vs $1/f$. Gradient = $v/4$.

**Improving Accuracy**

- Average length from raising and lowering.
- Perform end correction.

**Safety**

- Mop up water spills.

---

### 19. Determining the Planck Constant ($h$)

Using LED "turn-on" voltage.

**Equipment**

- LEDs of different wavelengths
- Power supply, voltmeter, resistor

**Method &amp; Data Analysis**

1. Increase voltage until LED just glows; record threshold $V\_0$.
2. Repeat for different colors.
3. **Data Analysis:** $eV\_0 = hc/\\lambda$.
4. **Data Analysis:** Plot $V\_0$ vs $1/\\lambda$. Gradient = $hc/e$.

**Improving Accuracy**

- Use a dark room to see initial glow.
- Extrapolate $I-V$ graph to $I=0$.

**Safety**

- Do not exceed LED current rating.

---

### 20. Demonstration of the Photoelectric Effect

Evidence for light as a particle.

**Equipment**

- Gold-leaf electroscope, zinc plate
- UV lamp, emery paper

**Method &amp; Data Analysis**

1. Clean zinc plate and place on negatively charged electroscope.
2. Shine UV; leaf falls as electrons emit.
3. Repeat with glass (absorbs UV) or positive charge (no emission).
4. **Data Analysis:** $hf = \\Phi + KE\_{max}$.

**Improving Accuracy**

- Ensure zinc is freshly sanded.
- Use a dry room.

**Safety**

- **UV Safety:** Wear UV-filtering goggles; do not look at lamp.

---

## Module 5: Newtonian World and Astrophysics

### 21. Experimental Evidence of Electron Diffraction

Demonstrating wave-like nature of electrons.

**Equipment**

- Electron diffraction tube
- EHT power supply

**Method &amp; Data Analysis**

1. Accelerate electrons through graphite target.
2. Measure diffraction ring diameters ($D$) on screen.
3. **Data Analysis:** Calculate $\\lambda = \\frac{h}{\\sqrt{2meV}}$.
4. **Data Analysis:** Verify with $n\\lambda = d \\sin \\theta$.

**Improving Accuracy**

- Darkened room for visibility.
- Measure at multiple voltages.

**Safety**

- **High Voltage:** Do not touch terminals.
- **Fragile Vacuum:** Handle tube with care.

---

### 22. Observing Brownian Motion

Evidence for kinetic theory of gases.

**Equipment**

- Smoke cell, microscope, lamp

**Method &amp; Data Analysis**

1. Seal smoke in cell and illuminate from side.
2. Observe random, jerky motion under microscope.
3. **Data Analysis:** Conclude bombardment by invisible air molecules.

**Improving Accuracy**

- Ensure cell is airtight.
- Let lamp warm up to avoid convection.

**Safety**

- Use matches/smoke in ventilated area.

---

### 23. Determining Specific Heat Capacity

Measuring energy to raise material temperature.

**Equipment**

- Metal block, immersion heater, thermometer
- Ammeter, Voltmeter, Stopwatch, Insulation

**Method &amp; Data Analysis**

1. Measure mass ($m$) and insulate block.
2. Record Temperature vs Time while heating.
3. **Data Analysis:** $E = VIt$.
4. **Data Analysis:** $P = mc \\times (\\Delta \\theta / \\Delta t)$.

**Improving Accuracy**

- Use oil in holes for thermal contact.
- Measure max temperature after heater is off.

**Safety**

- Heater gets very hot; use only when submerged.

---

### 24. Determining Specific Latent Heat

Energy for change of state at constant temperature.

**Equipment**

- Ice/Water, immersion heaters, balances

**Method &amp; Data Analysis**

1. Use a "test" and "control" setup for melting ice.
2. Measure mass melted by heater ($m = m\_{test} - m\_{control}$).
3. **Data Analysis:** $L\_f = VIt / m$.

**Improving Accuracy**

- Ensure ice is at $0\\text{°C}$.
- Steady boil for vaporisation.

**Safety**

- Avoid steam burns and keep water from electronics.

---

### 25. Investigating Gas Laws

Exploring P, V, and T relationships.

**Equipment**

- Boyle’s Law apparatus, constant volume bulb
- Pressure gauge, water bath

**Method &amp; Data Analysis**

1. **Boyle:** Plot $P$ vs $1/V$.
2. **Pressure:** Plot $P$ vs $T$ (Celsius); extrapolate to $P=0$ for absolute zero.

**Improving Accuracy**

- Change volume slowly (isothermal).
- Submerge entire gas volume in water bath.

**Safety**

- Do not exceed pressure limits.

---

### 26. Investigating Circular Motion

Relationship between force, mass, velocity, and radius.

**Equipment**

- Rubber bung, tube, string, masses
- Stopwatch, balance, ruler

**Method &amp; Data Analysis**

1. Whirl bung in horizontal circle with hanging mass providing centripetal force ($F=Mg$).
2. Maintain constant radius ($r$) and record time for 20 rotations.
3. **Data Analysis:** Calculate $v = 2\\pi r / T$.
4. **Data Analysis:** Plot $F$ vs $v^2$. Gradient = $m/r$.

**Improving Accuracy**

- Use slow-motion camera for rotations.
- Whirl as horizontally as possible.

**Safety**

- Clear "no-go" zone for swinging bung.
- Wear goggles.

---

### 27. Determining Period/Frequency of SHM

Factors affecting oscillating systems.

**Equipment**

- Masses, spring or pendulum
- Stopwatch, fiducial marker

**Method &amp; Data Analysis**

1. Displace mass and record time for 20 oscillations.
2. Vary mass (spring) or length (pendulum).
3. **Data Analysis (Spring):** Plot $T^2$ vs $m$. Gradient = $4\\pi^2/k$.
4. **Data Analysis (Pendulum):** Plot $T^2$ vs $L$. Gradient = $4\\pi^2/g$.

**Improving Accuracy**

- Use fiducial marker at equilibrium.
- Small angles ($&lt;10^\\circ$) for pendulum.

**Safety**

- Padded catch box for falling masses.

---

## Module 6: Particles and Medical Physics

### 28. Investigating Capacitors in Combination

Verifying series and parallel rules.

**Equipment**

- Capacitors, multimeters

**Method &amp; Data Analysis**

1. Measure $C\_{total}$ for series and parallel arrangements.
2. **Data Analysis:** Parallel $C\_{total} = \\sum C$; Series $1/C\_{total} = \\sum 1/C$.

**Improving Accuracy**

- Account for zero error of meter.

**Safety**

- Check polarity of electrolytic capacitors.

---

### 29. Investigating Capacitor Charge and Discharge

Exponential decay of voltage/current.

**Equipment**

- Capacitor, resistor, DC source, stopwatch

**Method &amp; Data Analysis**

1. Charge capacitor then discharge through resistor.
2. Record $V$ vs time.
3. **Data Analysis:** Plot $\\ln V$ vs $t$. Gradient = $-1/RC$.
4. **Data Analysis:** Time constant $\\tau$ is time to fall to $37%$.

**Improving Accuracy**

- Use high-resistance voltmeter.

**Safety**

- Capacitors store energy; discharge safely.

---

### 30. Determining Magnetic Flux Density ($B$)

Using a current balance to measure force.

**Equipment**

- Magnets, top-pan balance, stiff wire
- Power supply, ammeter

**Method &amp; Data Analysis**

1. Place magnets on balance and tare.
2. Run current through wire between magnets.
3. Record mass change ($\\Delta m$) for different currents ($I$).
4. **Data Analysis:** $F = \\Delta mg$. Plot $F$ vs $I$. Gradient = $BL$.

**Improving Accuracy**

- Wire must be perfectly perpendicular to field.
- Use high-precision balance.

**Safety**

- Strong magnets (keep away from cards/pacemakers).

---

### 31. Investigating Magnetic Flux with Search Coils

Mapping field strength and orientation.

**Equipment**

- Search coil, solenoid, signal generator, CRO

**Method &amp; Data Analysis**

1. Place search coil in solenoid with AC field.
2. Record induced e.m.f. ($V\_0$).
3. Vary angle ($\\theta$) or position.
4. **Data Analysis:** $V\_0 \\propto BAN\\omega$.

**Improving Accuracy**

- High frequency for larger e.m.f.
- Keep away from other metal objects.

**Safety**

- Do not let solenoid overheat.

---

### 32. Investigating Transformers

Turn ratios and voltage relationships.

**Equipment**

- C-cores, copper wire, AC supply, voltmeters

**Method &amp; Data Analysis**

1. Wrap primary and secondary coils on C-cores.
2. Measure $V\_p$ and $V\_s$ for different $N\_s$.
3. **Data Analysis:** $\\frac{V\_s}{V\_p} = \\frac{N\_s}{N\_p}$.

**Improving Accuracy**

- Clamp cores tightly.
- Laminated cores reduce losses.

**Safety**

- **Low Voltage AC Only.**

---

### 33. Absorption of Alpha, Beta, and Gamma Radiation

Testing penetrating power.

**Equipment**

- Sources, G-M tube and counter
- Absorbers: Paper, Aluminum, Lead

**Method &amp; Data Analysis**

1. Measure background count.
2. Measure count rate with source and different absorbers.
3. **Data Analysis:** Use corrected count rate (Total - Background).

**Improving Accuracy**

- Long counting times.
- Constant source-tube distance.

**Safety**

- **Time, Distance, Shielding.** Use forceps.

---

### 34. Determining the Half-Life of an Isotope

Measuring decay rate over time.

**Equipment**

- Protactinium generator, G-M tube, data logger

**Method &amp; Data Analysis**

1. Shake generator and record count rate every 10s.
2. **Data Analysis:** Plot corrected count rate vs time.
3. **Data Analysis:** Find time to halve ($t\_{1/2}$). Or plot $\\ln(\\text{Count Rate})$ vs $t$; gradient = $-\\lambda$.

**Improving Accuracy**

- Start readings immediately after shaking.

**Safety**

- Sealed source but handle with care.

---

### 35. Simulation of Radioactive Decay

Statistical model using dice.

**Equipment**

- Large number of dice

**Method &amp; Data Analysis**

1. Roll dice and remove those showing a "6".
2. Record remaining dice ($N$) vs throw number ($t$).
3. **Data Analysis:** Plot $N$ vs $t$ for exponential curve.
4. **Data Analysis:** Verify $\\lambda = 1/6$.

**Improving Accuracy**

- Use large starting number (500+).

